
AWS CloudWatch Agent Setup: Meet Your Monitoring Needs
Introduction
AWS CloudWatch is great for monitoring resources and analyzing business performance in AWS. However, you might need to track specific metrics or collect data from local servers. This is where AWS CloudWatch Agent comes in. Now, you will learn how to set up AWS CloudWatch Agent and understand why you should use it.
AWS CloudWatch Agent Install & Usage
AWS CloudWatch Agent is a software you can use to collect custom metrics and gather data from local servers. You can install CloudWatch Agent on local servers, Amazon Elastic Compute Cloud (EC2) instances, and hybrid environments. What about exploring some reasons to use AWS CloudWatch Agent?
Monitor Custom Metrics
CloudWatch collects a set of default metrics from AWS services and EC2 instances. However, your business may need to monitor custom metrics.
Installing the CloudWatch Agent on servers or EC2 instances allows you to collect custom metrics and send them to CloudWatch.
Collecting Data from Local Servers
AWS CloudWatch does not automatically collect data from local servers. However, you can collect system metrics, application logs, and performance data from local servers using the CloudWatch Agent. This provides a single monitoring point in the AWS cloud and your local infrastructure.
Customizable Data Collection
CloudWatch Agent allows you to customize the data it collects. For example, you may want to monitor the performance of a specific process or service. With CloudWatch Agent, you can collect and analyze this data.
CloudWatch Default Metrics
CloudWatch collects a set of default metrics from AWS services. However, some metrics are not visible by default. Here are some metrics that we cannot see by default with CloudWatch:
Memory Utilization
CloudWatch does not monitor the memory usage of EC2 instances by default. In this case, you can monitor memory utilization through CloudWatch Agent or custom metrics. So, you can monitor the percentage of memory utilization, the amount of memory used, and other memory performance metrics.
Swap Utilization
CloudWatch does not monitor swap utilization of EC2 instances by default. However, you can monitor swap utilization through CloudWatch Agent or custom metrics. This allows you to monitor swap utilization percentage, amount of swaps used, and other swap performance metrics.
Disk Utilization
CloudWatch does not monitor disk usage of EC2 instances by default. Thanks to CloudWatch Agent, you can monitor disk usage and collect relevant metrics. This allows you to monitor disk occupancy, disk I/O, and disk availability.
Transaction and Resource Monitoring
CloudWatch does not provide transaction-level metrics by default. However, you can monitor memory usage, disk I/O, network resources, and other compute-level metrics through CloudWatch Agent or custom metrics.
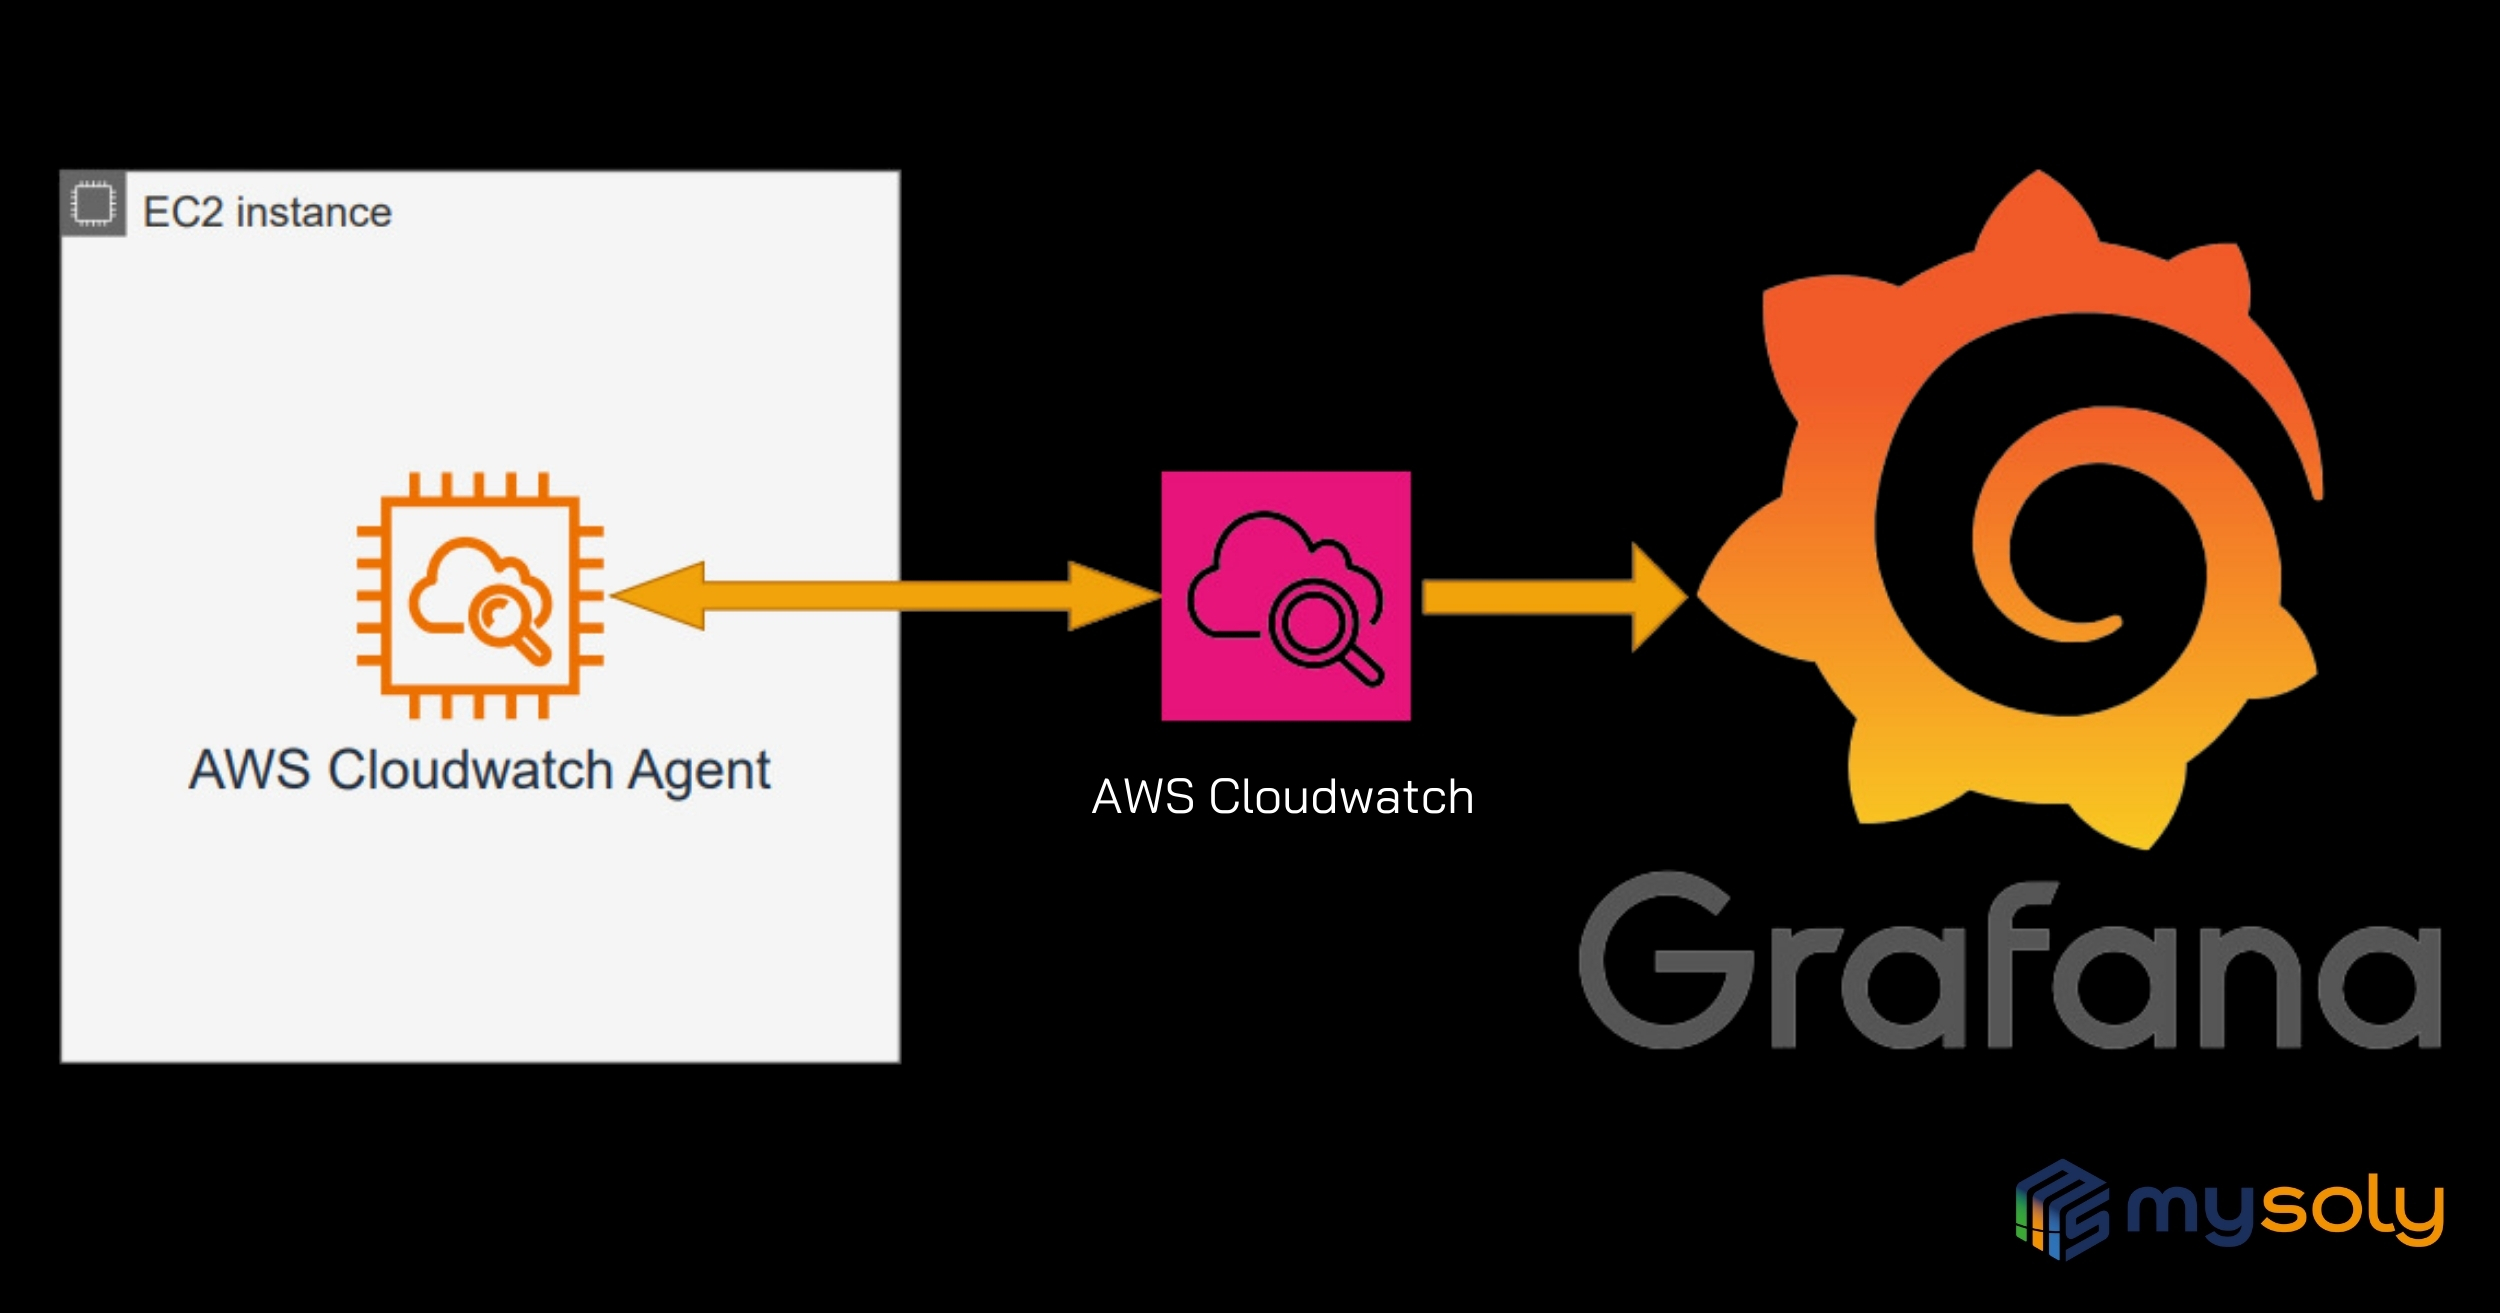
AWS CloudWatch Agent Setup
AWS CloudWatch Agent installation is quite simple. In our previous Grafana articles, we explained how we can visualize the metrics we pull from Cloudwatch. Let’s imagine that we have a ready server and we visualize the metrics by installing Grafana. If you want to remember the steps, you will find the related articles on our blog page. Let’s now focus on installing the CloudWatch Agent and transferring metrics to CloudWatch on our server.
Here is the step-by-step installation process:
- Create a role and assign it to the server
- Download the Cloudwatch agent to the server and make configuration settings
- Validate the relevant custom metric we created on Cloudwatch
- Visualize custom metrics created with Cloudwatch agent in Grafana
Create a role and assign it to the server
Since we will download CloudWatch Agent to EC2 instance, we will need to create a role to transfer metrics. After assigning the relevant policy to the role, we need to attach the role we created to the EC2 instance.
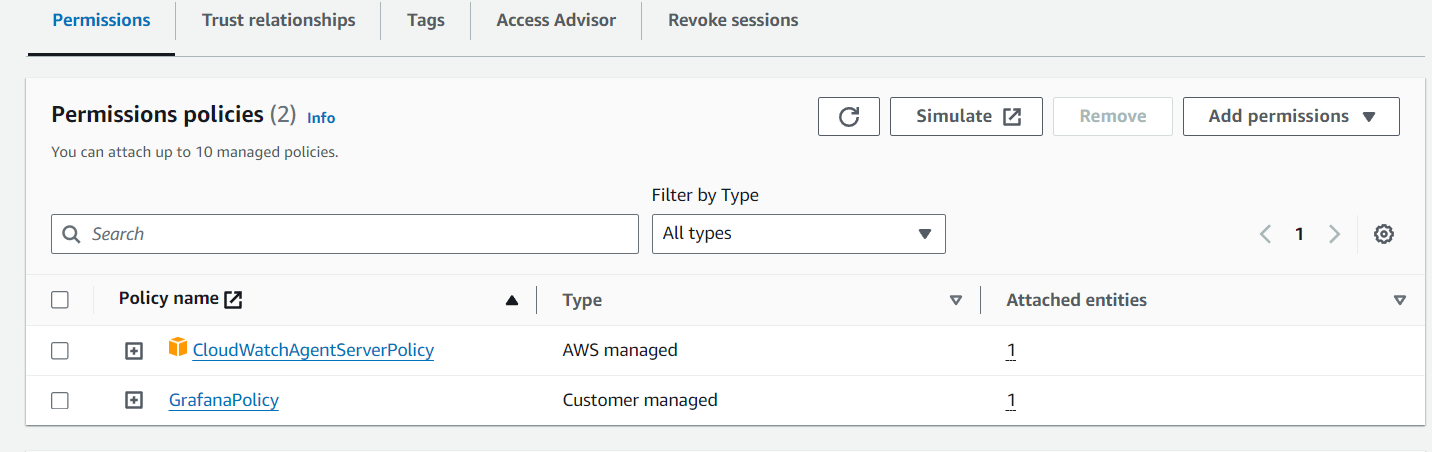
In our previous articles, we created a role named “GrafanaRole”. Now we only need to select CloudWatchAgentServerPolicy in the Policies list and save it. Since this role is already assigned to the server, it will automatically receive this policy. If we want to create a role from scratch, do not forget to attach this role to the EC2 instance.
Create a role and assign it to the server
Download the CloudWatch Agent suitable for your operating system. We will install on the Ubuntu server. This is the part we will focus on throughout this article. Also, there is a very clear article in AWS documentation for installation. You can reach it from here.
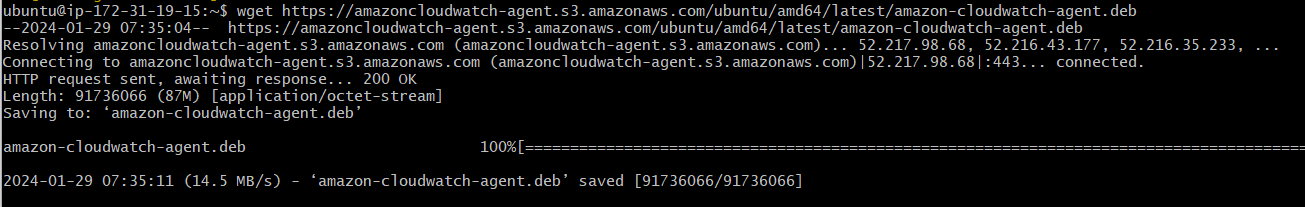
Download and install the package
Command line to download and install the CloudWatch Agent package:
wget https://amazoncloudwatch-agent.s3.amazonaws.com/ubuntu/amd64/latest/amazon-cloudwatch-agent.deb
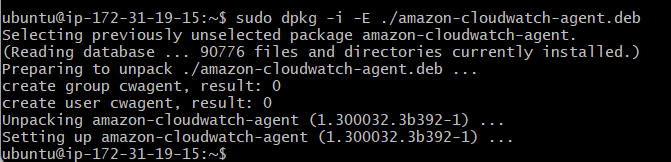
Execute the command
Navigate to the directory containing the package on the Ubuntu server and execute the following command:
sudo dpkg -i -E ./amazon-cloudwatch-agent.deb
Update the server
Now update the server with the following command:
sudo apt update Create CloudWatch Agent Configuration File
Before starting the CloudWatch agent, you need to create a CloudWatch agent configuration file. This configuration file specifies the metrics, logs, and other settings that the agent will collect. Amazon provides a tool called “amazon-cloudwatch-agent-config-wizard” which is a wizard to create this configuration file. This is a JSON file and we can use it without running the wizard if we have one ready.
Use the following command to create a CloudWatch agent configuration file:
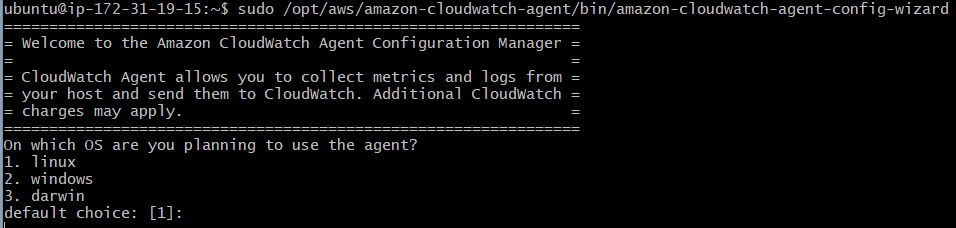
sudo /opt/aws/amazon-cloudwatch-agent/bin/amazon-cloudwatch-agent-config-wizard
The wizard will ask a series of questions to determine the settings of the agent for collecting measurements and logs. For example, it will prompt you to specify the metrics to collect, measurement intervals, log files’ location, and other settings. Proceed by answering the questions and select the configuration options. The wizard will create a configuration file based on your answers. The wizard will save the configuration file in /opt/aws/amazon-cloudwatch-agent/etc/amazon-cloudwatch-agent.json.
As we mentioned above, if we have this configuration file, we can save it in this directory. Moreover, if we want to make updates to this file, we can make changes with the help of the editor.
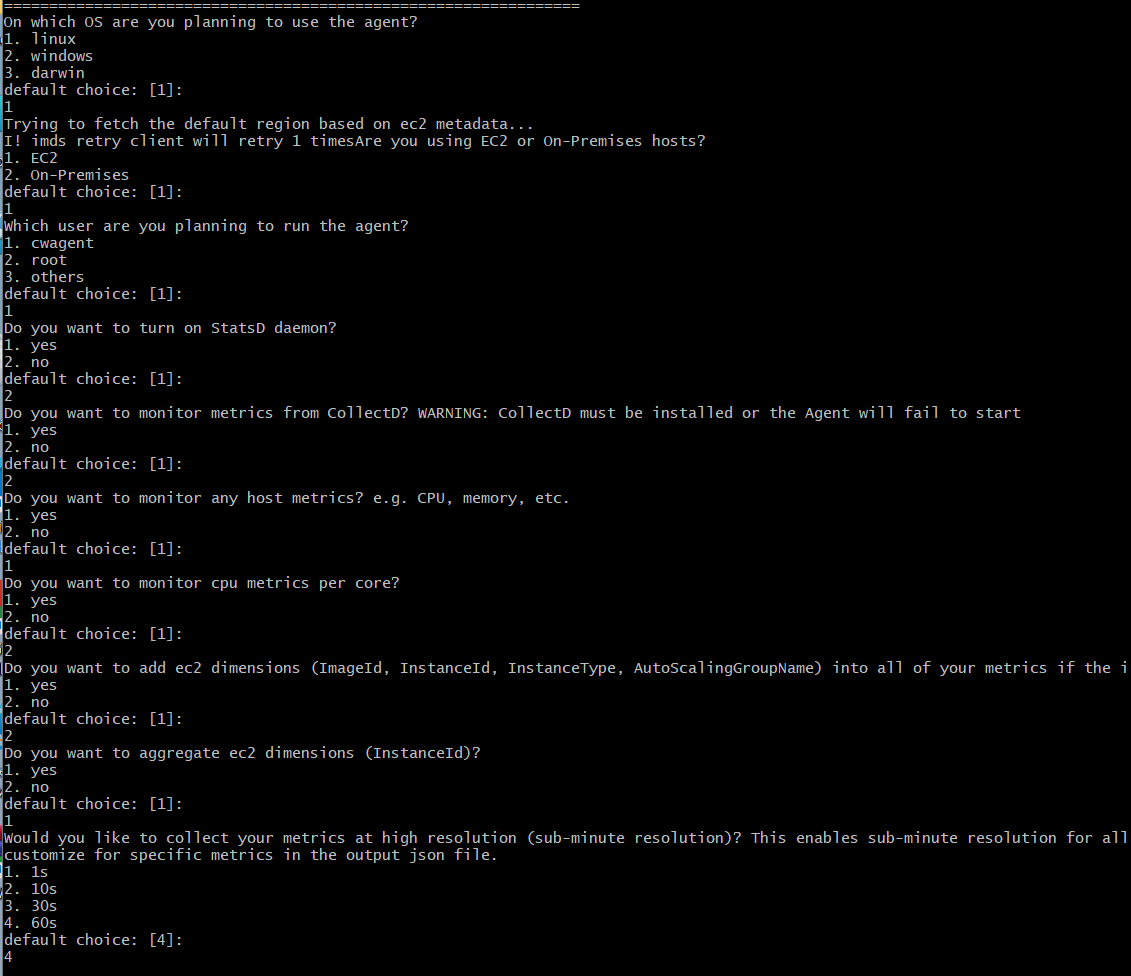
We share below the questions we will encounter after running the wizard. We can follow the default suggestions or we can make our custom selections.
AWS defined categories
After making and confirming all selections, our configuration file is here. We have also shared the configuration file below. But there is one thing we want to remind here. There are limited metrics that we can pull from the server with Claudwatch Agent. And AWS has defined three categories “basic, standard, advanced”. While making the selections above, we come across this selection. We would like to share the section about this with you.
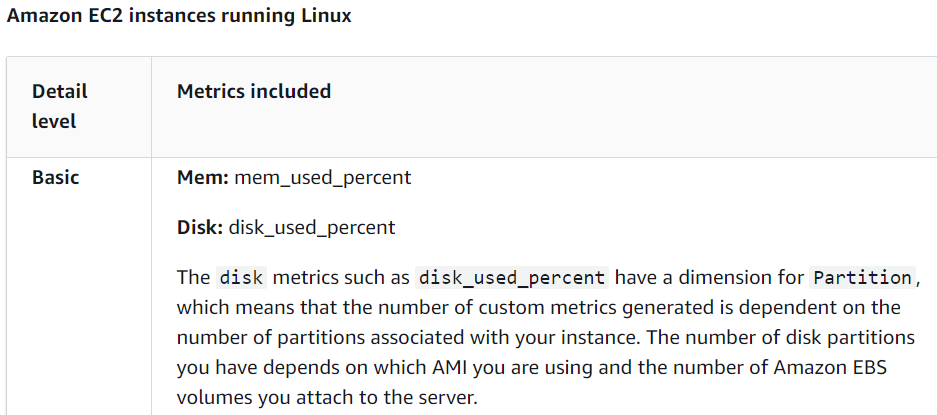
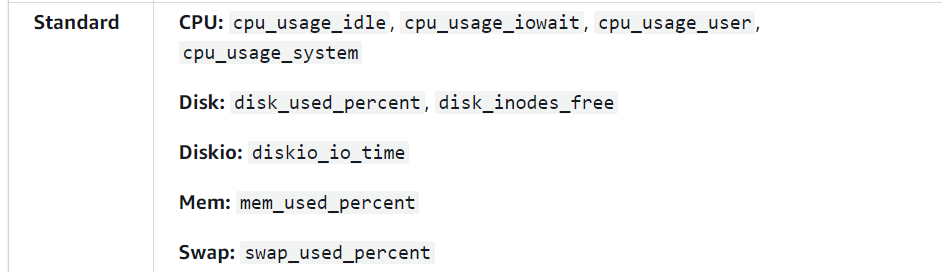
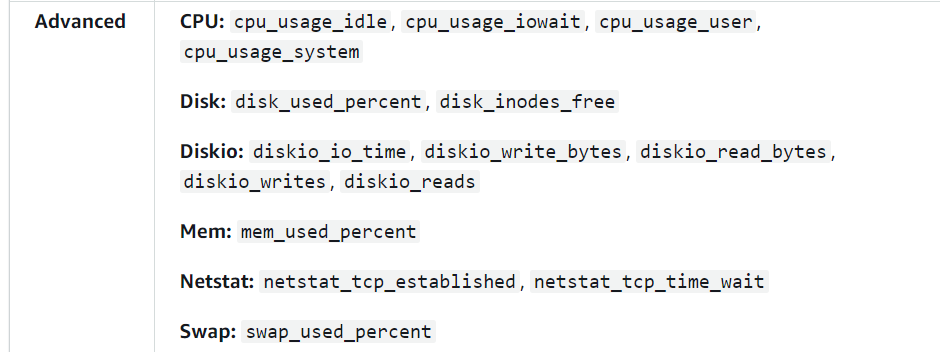
This section clearly specifies the contents of the category. We can choose the most appropriate one according to our own conditions. At the moment we have chosen the “standard” one.
The resulting Configuration file:
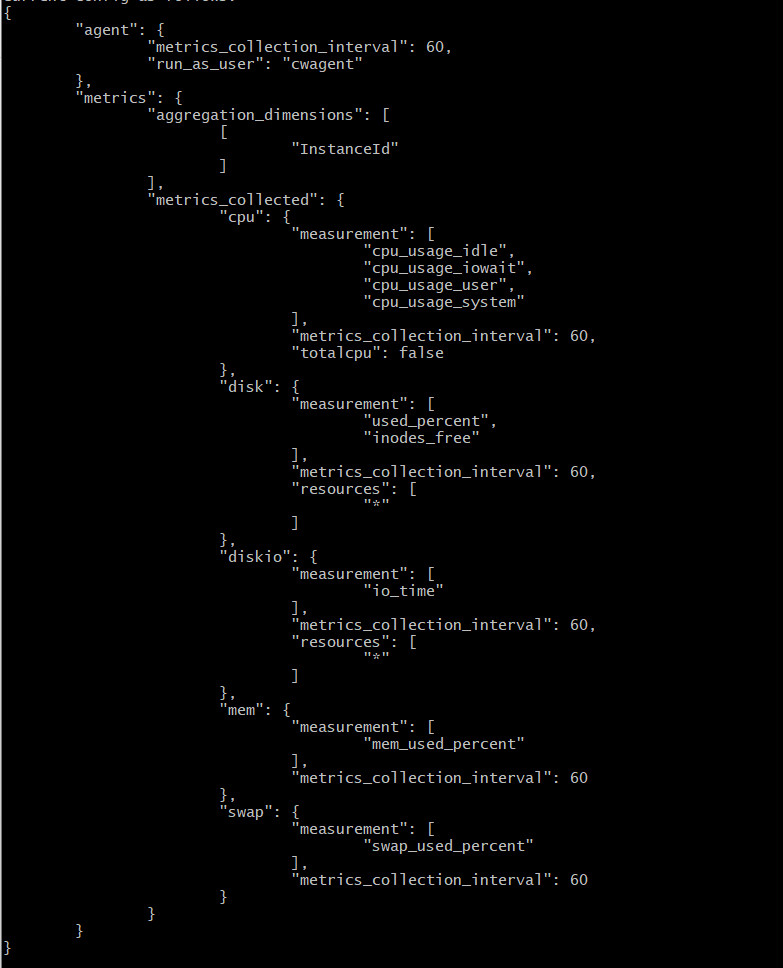
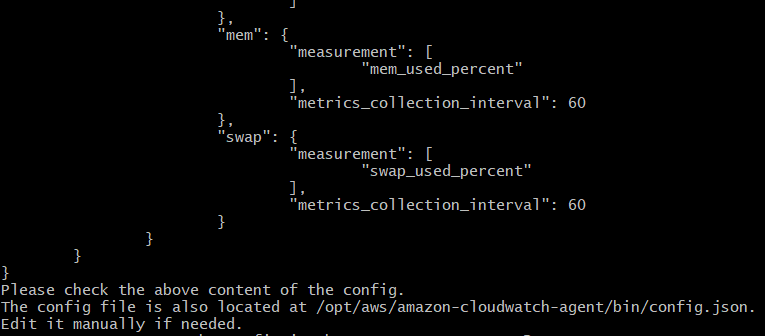
What we need to pay attention to here is the part where it shows the file path. To start the CloudWatch agent, we need to specify the correct file path. This path is usually fixed, but it’s still worth confirming. It also informs us that we can edit this file. We can edit it with the help of any editor.
Edit the generated configuration file
We can use the following command to edit the generated configuration file:
sudo nano /opt/aws/amazon-cloudwatch-agent/etc/amazon-cloudwatch-agent.json
Launch the CloudWatch agent
After creating or editing the configuration file, use the following command to launch the CloudWatch agent:
sudo /opt/aws/amazon-cloudwatch-agent/bin/amazon-cloudwatch-agent-ctl -a fetch-config -m ec2 -c file:/opt/aws/amazon-cloudwatch-agent/bin/config.json –s 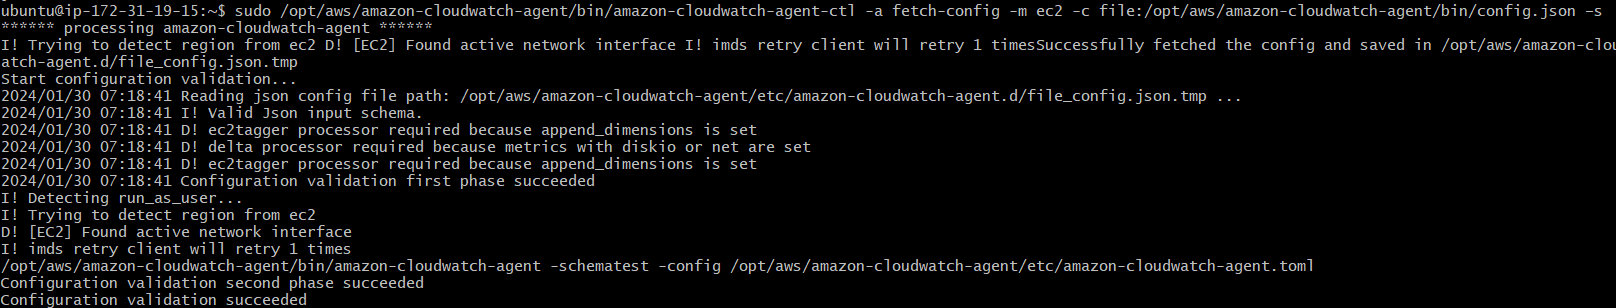
This command reads the configuration file and starts the agent.
Check the status or the CloudWatch agent
We can check the status of the CW agent. Here is the command to find out:
sudo /opt/aws/amazon-cloudwatch-agent/bin/amazon-cloudwatch-agent-ctl -m ec2 -a status 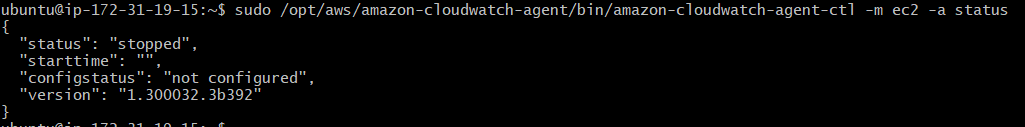
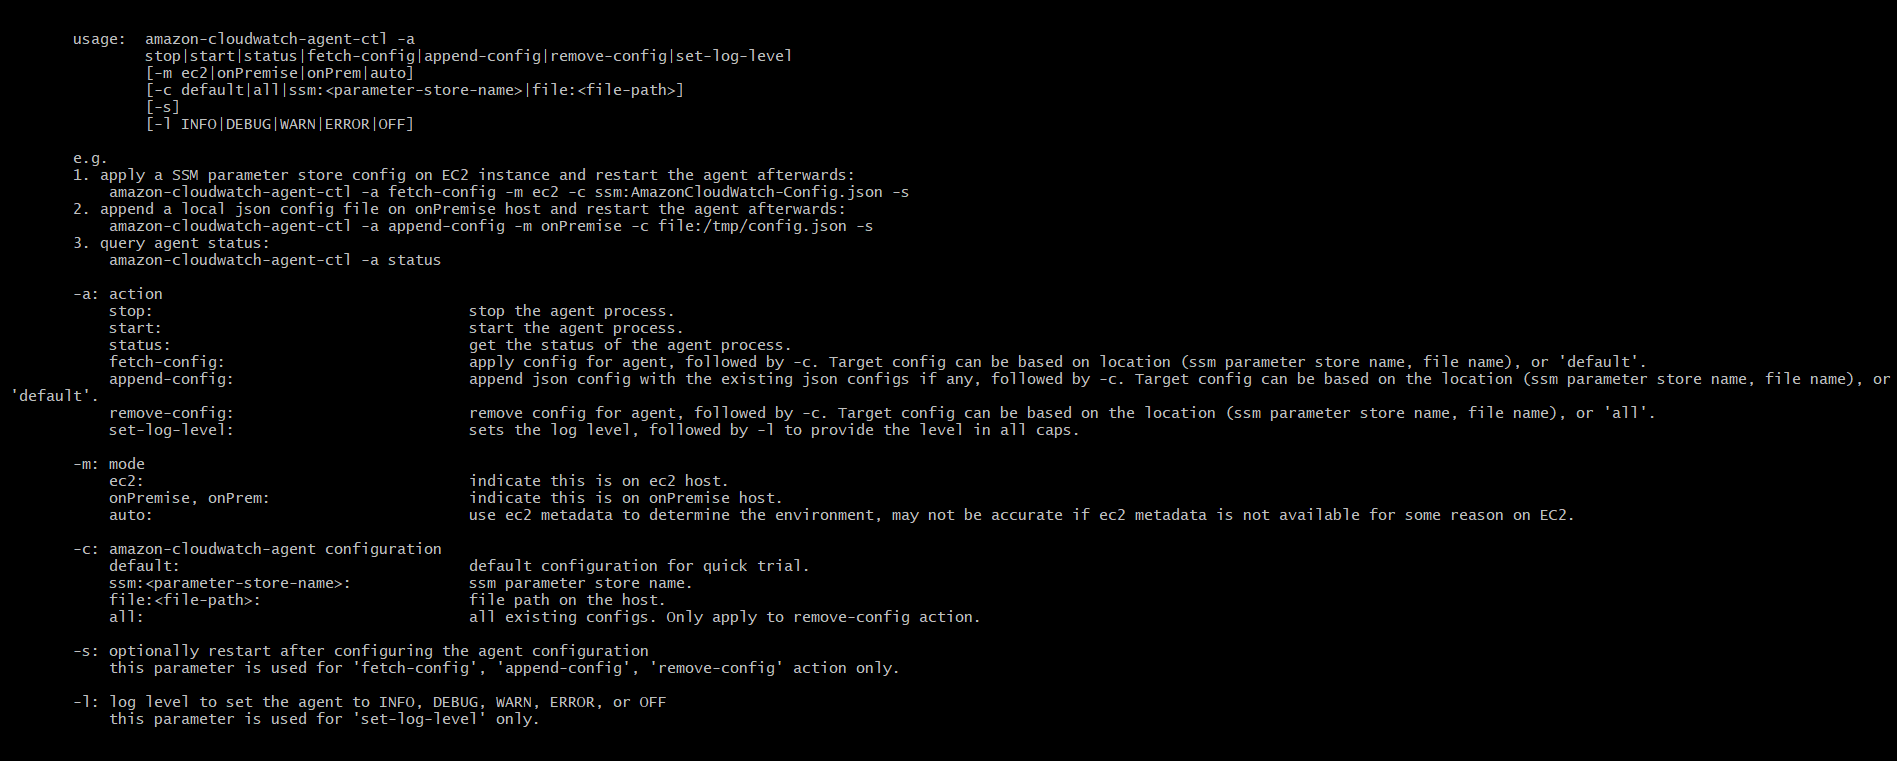
Start and stop the Cloudwatch Agent
The command where we can start and stop the Cloudwatch Agent:
sudo /opt/aws/amazon-cloudwatch-agent/bin/amazon-cloudwatch-agent-ctl -m ec2 -a start (stop) There is also information about these commands. If we forget, we can follow this information and remember the operations.
Validate the relevant custom metric we created on Cloudwatch
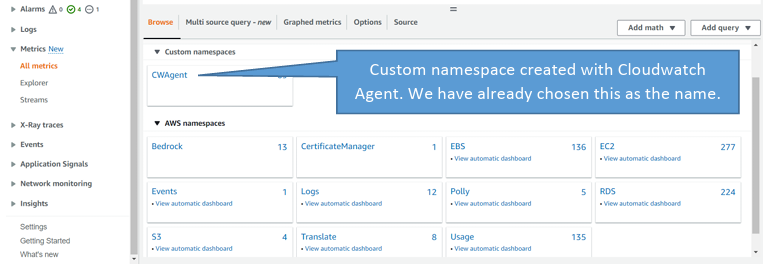
We downloaded and installed Cloudwatch Agent on our server. Now that we’ve set the necessary permissions, the server will send its metrics to CloudWatch. For this, there is a different namespace in the Cloudwatch service in the AWS account.
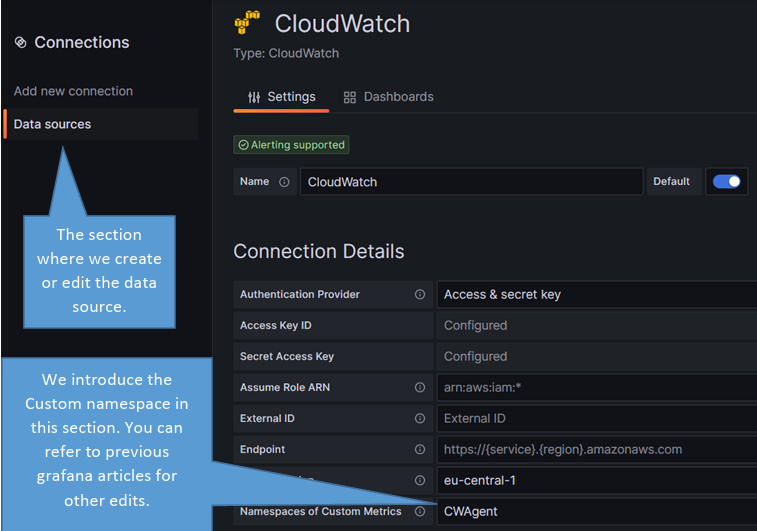
We need to define this custom namespace in the data source section in Grafana.
Visualize custom metrics created with Cloudwatch agent in Grafana
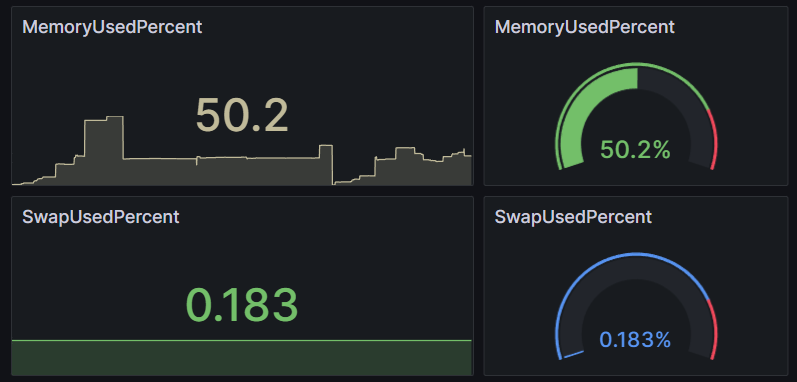
After editing the data source, we can now visualize the metrics on Grafana.
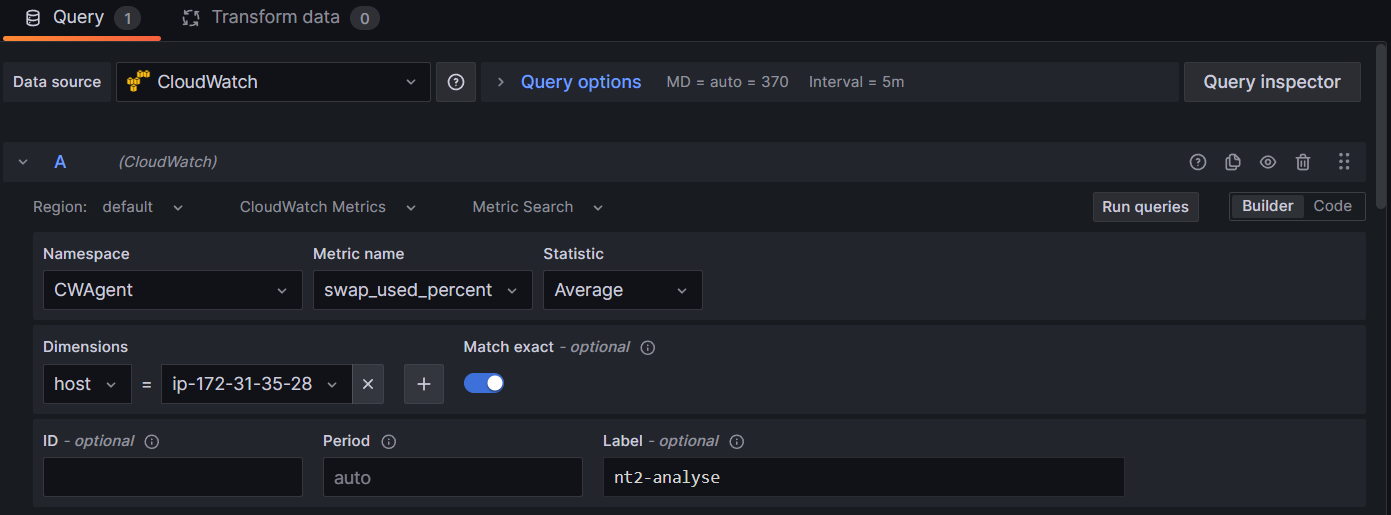
In the Namespace section, we select the custom namespace “CWagent” created with Cloudwatch agent. Since we have selected the standard category, we see the metric names by this category as “metric name”. We select the metric we want to visualize. Again, as “host”, we see which servers we have installed and activated the agent on. We have already explained these sections in detail in the previous article.
As an example, we have visualized the metrics “memory_used_percent” and “swap_used_percent”.
Conclusion
AWS CloudWatch Agent provides a critical tool for those seeking to monitor and manage cloud-based infrastructures. This article provides readers with solid guidance on the effective use of CloudWatch Agent. It covers the basic setup steps, the collection of custom metrics, and visualization with charts and graphs. CloudWatch Agent aims to make cloud-based infrastructure management more efficient. It offers users valuable advantages in optimizing system performance. In addition, it helps in detecting potential problems in advance.
Mysoly | Your partner in digital!