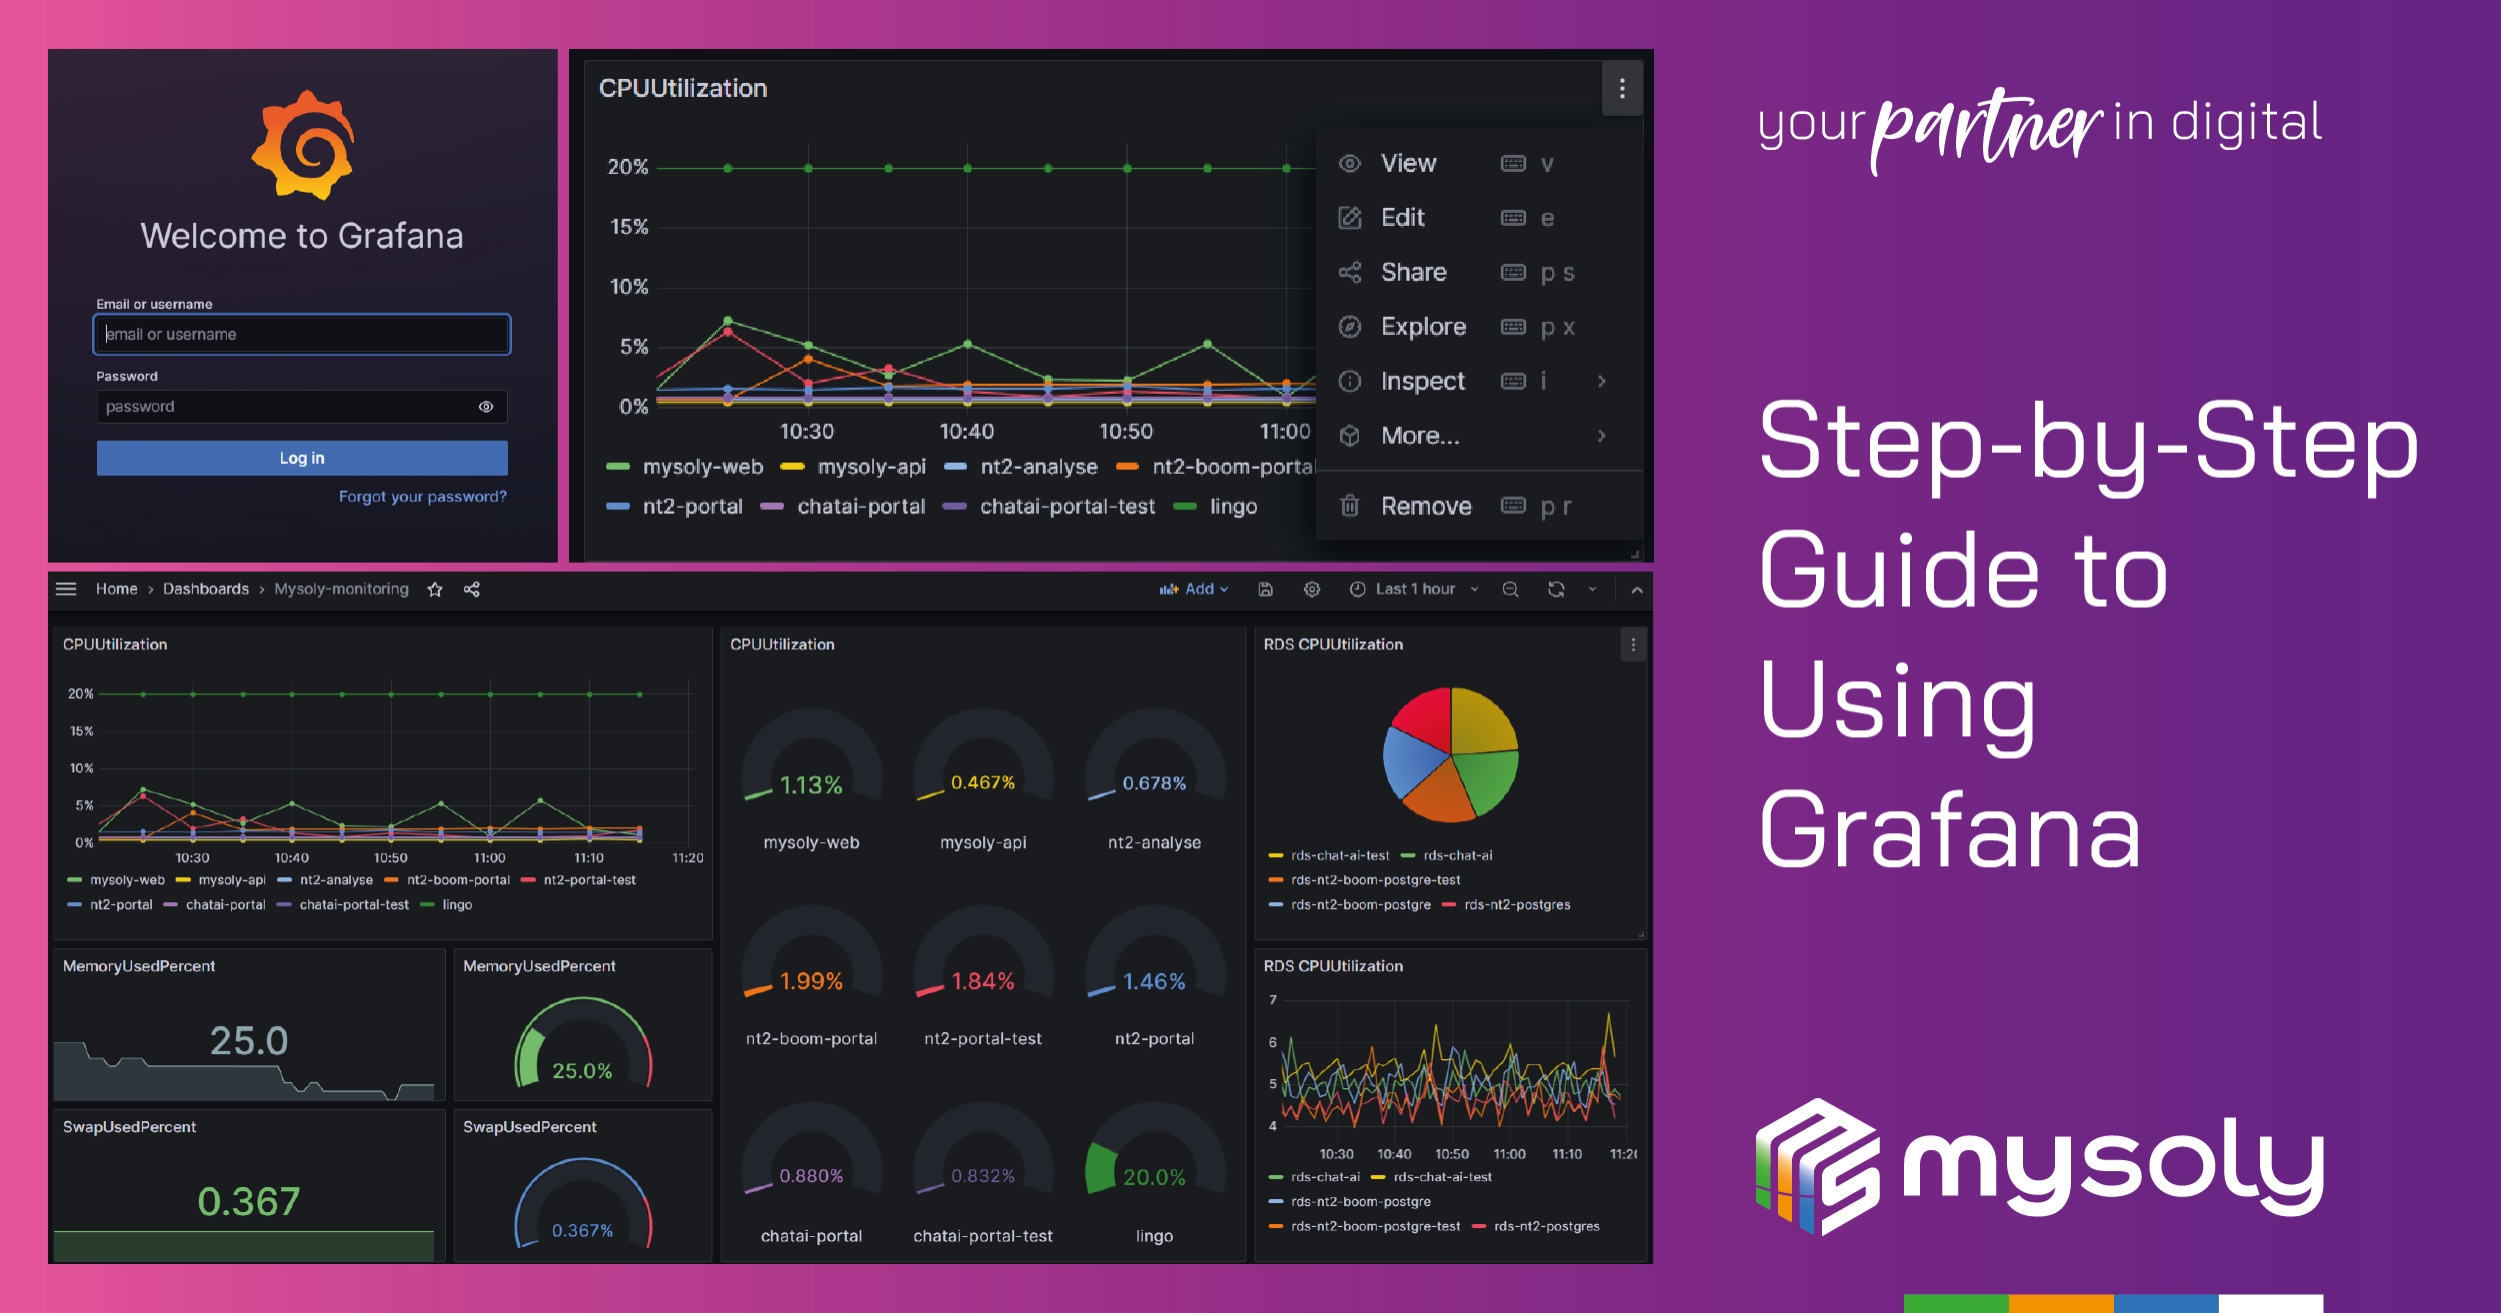
Step-by-Step Guide to Using Grafana: Unlocking the Power of Data Visualization
Introduction
The previous blog “Visualization and Monitoring with Grafana: An Introductory Guide” is about monitoring Grafana in a basic way. Now, we will learn Grafana in more depth in this blog. Grafana comes up with different usage alternatives. However, we will install Grafana Open Source. Also, we can install Grafana on various operating systems as well as run it on a docker container. In the software world where container technology is rapidly developing and widespread, compatibility with this technology is a must. (It can work compatible with the Kubernetes tool, which is especially trending in the field of microservices technology.) You can find very understandable documents on the web page about the installation of Grafana in different environments.
As mentioned above, we will be running Grafana in a docker container. First, we need a server. Since we will be using the AWS CloudWatch data source, we will run the server on AWS. You can choose this server based on your financial situation and the size of the project. If you are going to use this server only for Grafana, you don’t need a big server and docker container. But if you want to install it on a server where a project is running and you don’t want it to affect the running system in any case, the best way is to run it in a container. Now, here are the steps for creating the server, installing Docker, and then running Grafana on this server with the Grafana Docker image. Also, be sure that you will find very simple and nice documents in the link above.
We will use the AWS CloudWatch data source to create dashboards with Grafana. AWS CloudWatch is a monitoring and management service offered on the Amazon Web Services (AWS) cloud platform. CloudWatch monitors the performance and status of AWS resources (e.g. EC2 instances, RDS databases, Lambda functions), collects logs, and generates metrics. Note that since this is an AWS service, we can only pull metrics from our servers running on AWS. Moreover, there are different metrics tools that we can use on all platforms. Maybe we will have the opportunity to write tutorials about them in the future. The software world is renewing and growing every day. There are multiple different methods and tools to achieve a goal. The important thing is which one best suits your goals and wishes.
Now that we have a server running on AWS and Grafana installed, let’s delve into a practical approach for visualizing AWS CloudWatch metrics. To accomplish this seamlessly, we’ll explore the integration process and highlight the steps involved in connecting Grafana with AWS CloudWatch. First, let’s start by creating the permissions and roles we need. In AWS, a server needs roles to communicate with another AWS service. Therefore, we will create a policy for our AWS EC2 server to access Cloudwatch metrics. So let’s proceed by explaining step by step. Since the main purpose of this article is Grafana, please excuse us for going through these installations quickly.
Server Infrastructure Requirements for Grafana
Create Policy
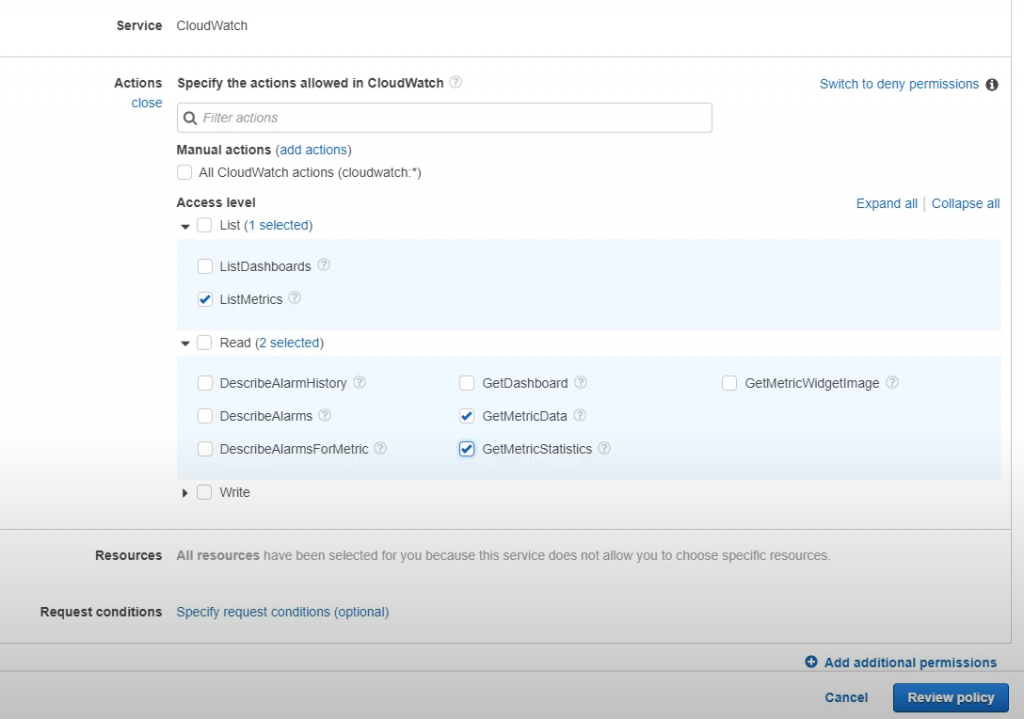
Let’s go to the AWS IAM service. After selecting the “Policies” tab, select the “Create policy” tab. To create a policy, select the “Visual Editor” section and make the selections we shared in the image below on the Cloudwatch service. Then confirm the selections and give the policy a name. We created this policy ourselves. AWS has similar policies ready for this topic. But we chose this to create a policy that best suits our needs.
Create Role
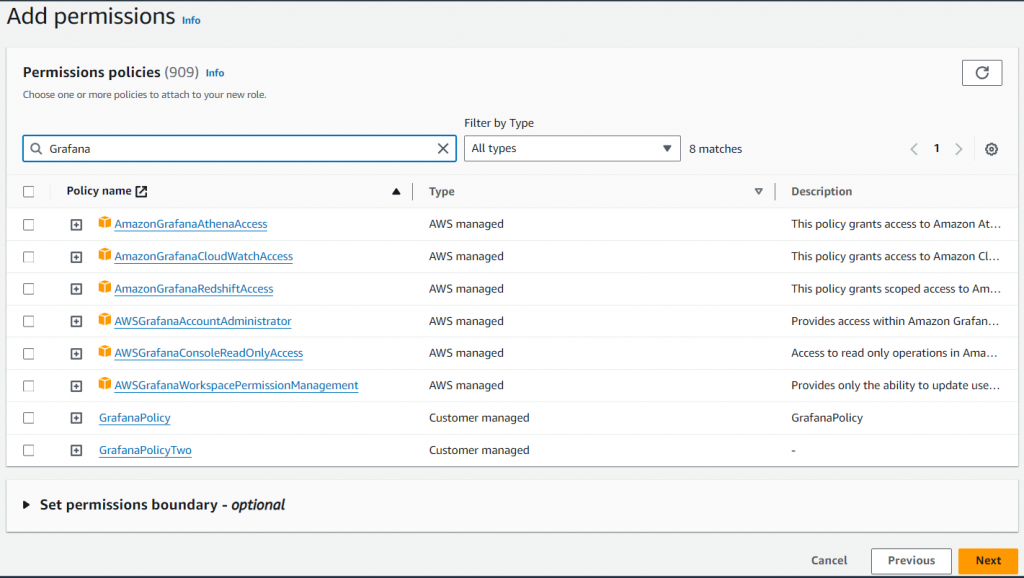
Now, we will create a role from the “Roles” tab on the IAM service. Since we assign a role to an AWS service, we will select “AWS Service” and then “EC2” from here. After that, we find and confirm the policy we just created for this role. Let’s give this role a name and complete the role creation.
Attach IAM role to AWS EC2 instance
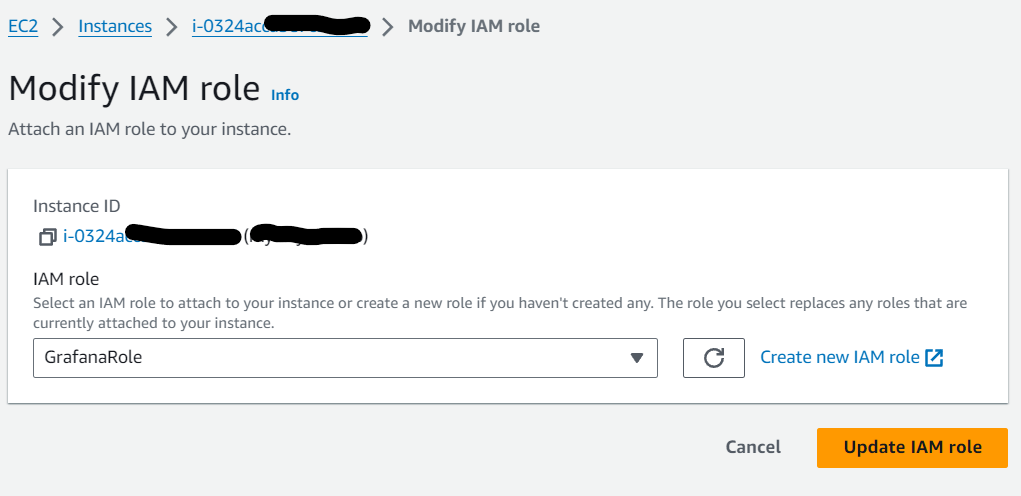
Now we have a role. We need to attach this role to our server. Therefore, we go to our server and attach our role to the server. So, our server can communicate with the Cloudwatch service.
Create a new user with the IAM Service
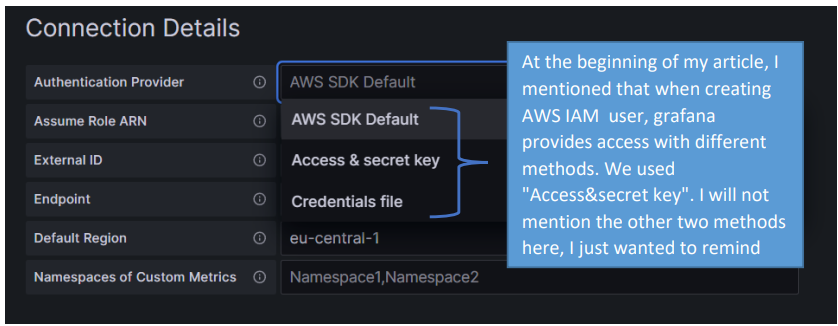
The last thing we will do on AWS is create a user and introduce it to Grafana. There is more than one method for this. However, we will provide access using the AWS access key and the AWS secret key. Of course, in this case, creating a new user and giving limited authorizations is the most reliable.
We will create a user from the “Users” tab in the same menu of the IAM service now. Then we will assign the policy we created above to this user.
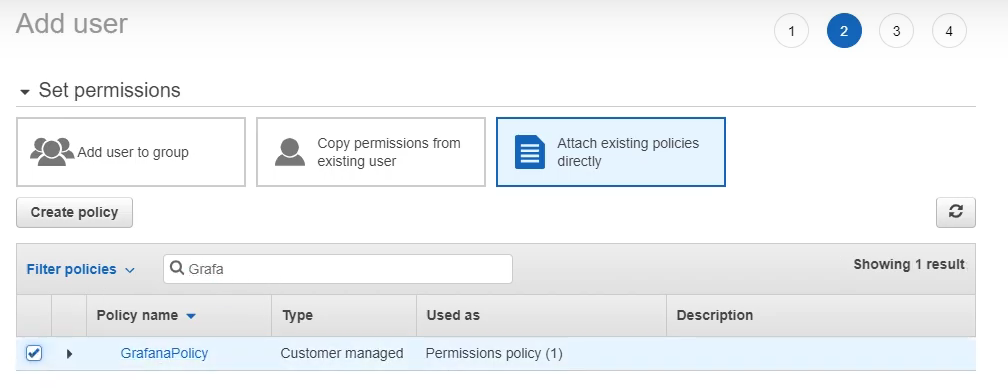
Here is a user. We will introduce the access key and secret key of this user to Grafana. When we come to that section, we will again show which methods Grafana can use to access our server on an AWS cloud service and get the metrics.
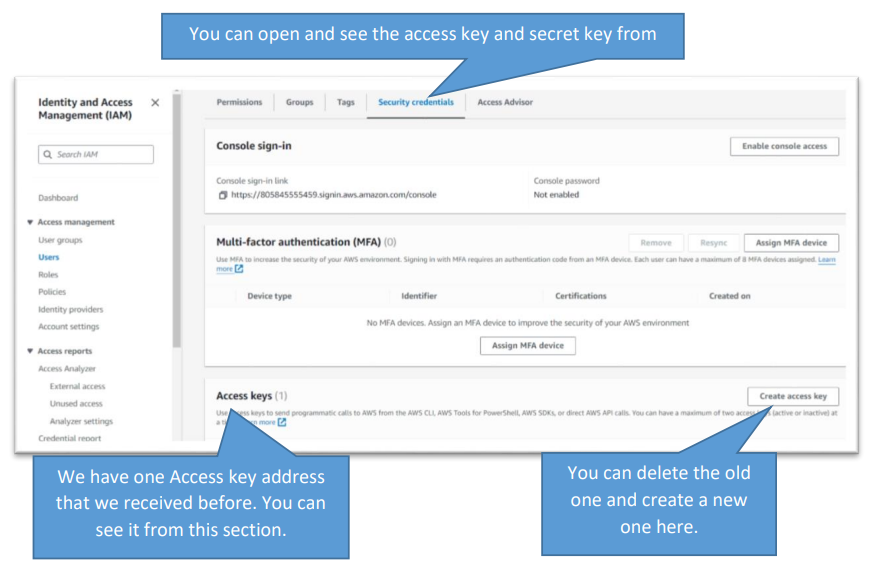
Let’s take the access key and secret key of our user and save them somewhere we will not forget. We can see the access key again, but we cannot see the secret key after these operations. When forgotten or deleted, we need to retrieve these keys again.
The operations we have done so far were preparatory operations on AWS. At the beginning of the blog, we entrusted you with the task of setting up a server and installing Docker on it. Subsequently, you successfully created a Docker container by utilizing the Grafana image. Now, let’s focus specifically on the Grafana image that is currently up and running.

Grafana Graphical User Interface Page Operations
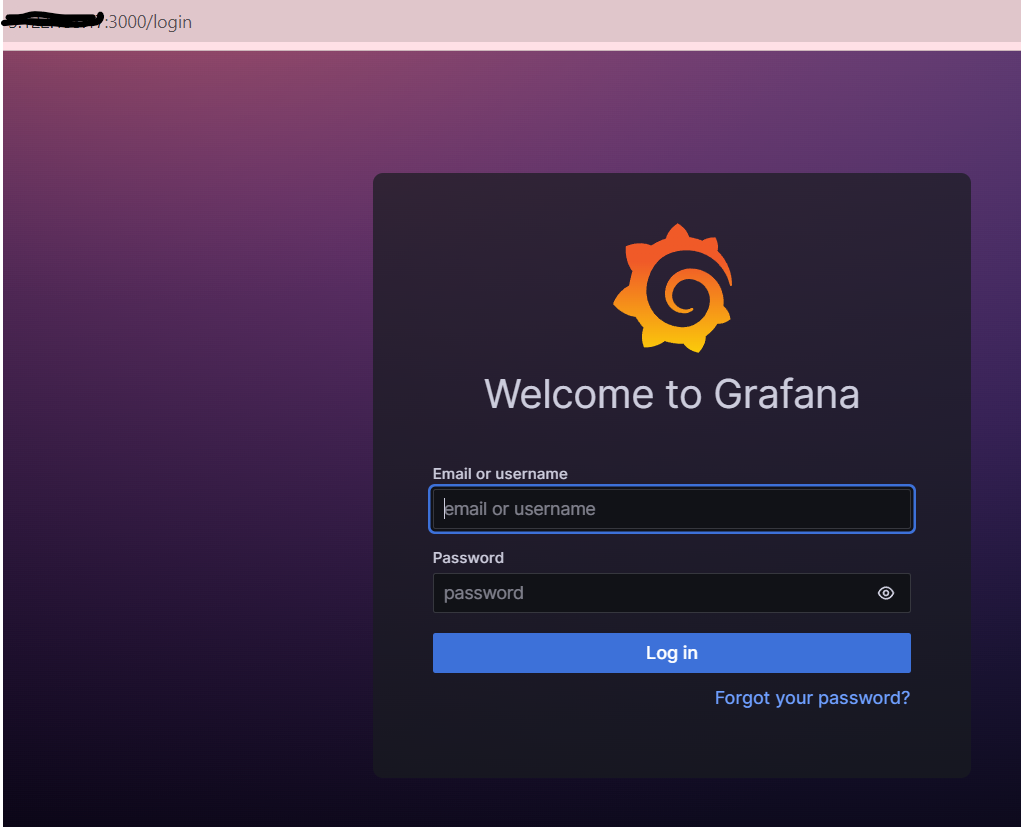
From the server, we will access the Grafana container on port 3000. This is important! Then we reach the Grafana login page with port 3000, which we will add to the public IP address of our server. On the opening page, we enter both the username and password as “admin” and then set our password.
Now that we have reached the Grafana Page, here are the next steps;
- Select Data Sources.
- Create a new dashboard.
- Import Dashboards from Grafana Labs.
Select Data Sources
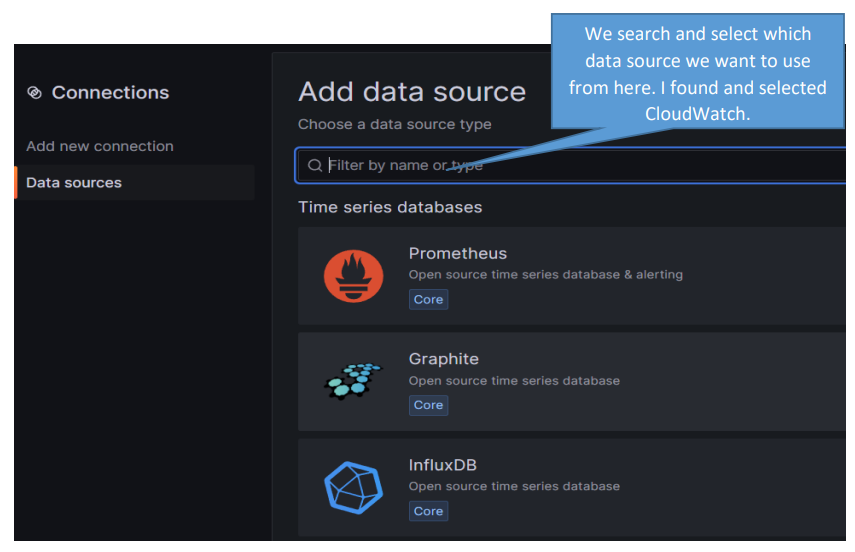
We have told you that we would use AWS Cloudwatch as the data source. We have the management of Grafana. Now let’s edit our Grafana page step by step and create those nice visuals we desire.
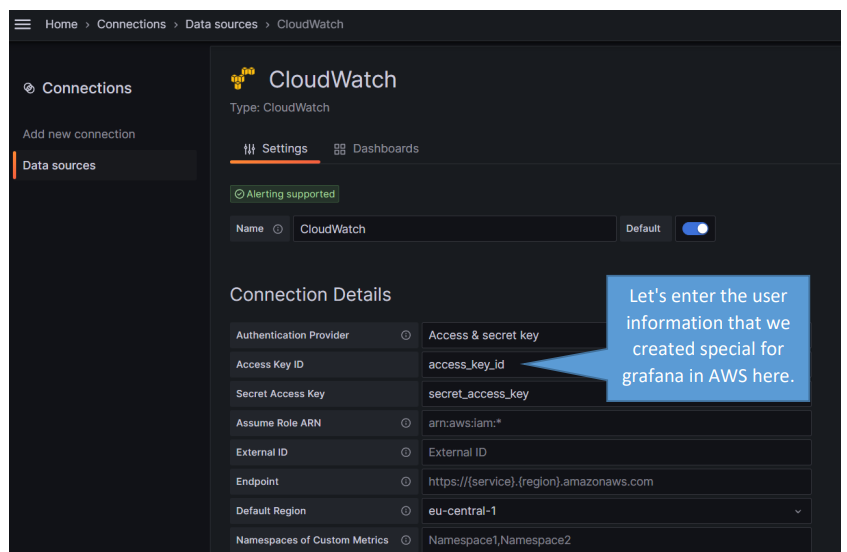
After entering the relevant information in this section, we save the data source. Now Grafana can pull the metrics it needs to visualize the existing metrics on Cloudwatch. Also, we want to mention an important issue here. Grafana can visualize the metrics that exist in the data source we created. In other words, whatever metrics Cloudwatch has, Grafana can only see and visualize those metrics. Therefore, we may not find every metric here.
For example, CloudWatch does not have metrics related to the “memory” usage of servers. This is the metric we would want to track first and foremost. We can solve this deficiency by creating a custom metric in AWS Cloudwatch. To achieve this, we can install a “Cloudwatch agent” on our server and pull metrics through this “Cloudwatch agent.” But since this is a topic in itself, we will cover it in our next blog.
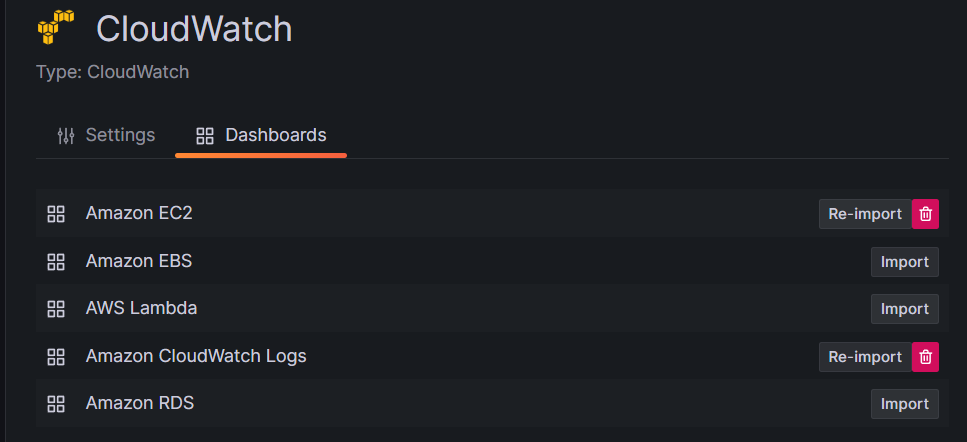
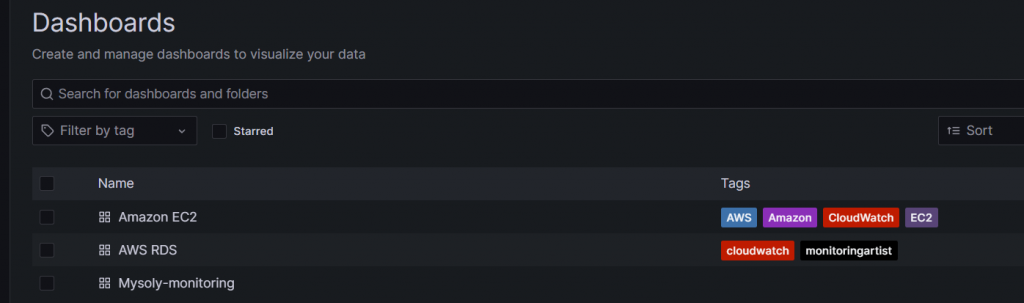
After completing and saving the operations under “Settings,” the dashboards we shared in the image are created by default in the “Dashboards” section. We can import and use any of them. Also, we can create our custom dashboards without using any of them. We will create a custom dashboard for ourselves, but we can also make edits to these default dashboards and customize them for ourselves.
Create a new dashboard
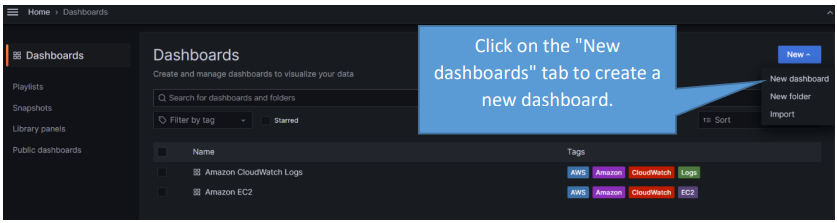
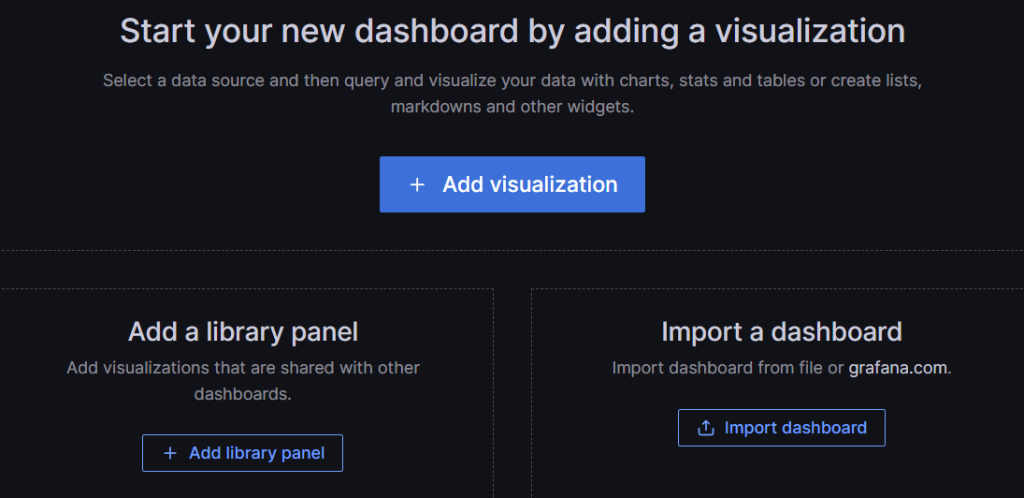
After confirming the “Add visualization” tab, let’s select Cloudwatch as the data source.
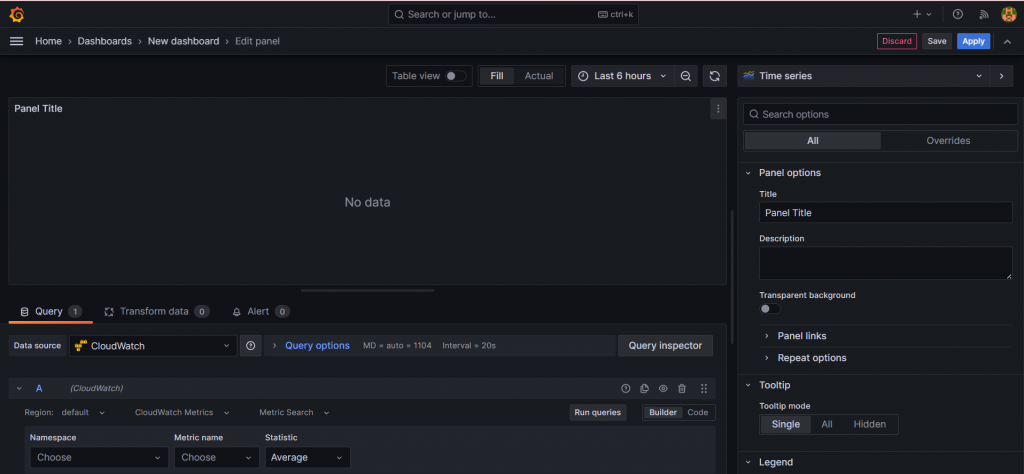
We will do almost everything on this page. So, we share and explain what we will do on this page, section by section.
- First, let’s explain what we are doing in the “Query” section. Since we have already introduced AWS Cloudwatch as the data source, Grafana automatically memorizes the metrics. In other words, whichever metrics Cloudwatch hosts, we have the opportunity to visualize them all in Grafana. Since we introduce the region by default at the beginning, it can remain by default. In the image we shared below, the important places are as follows:
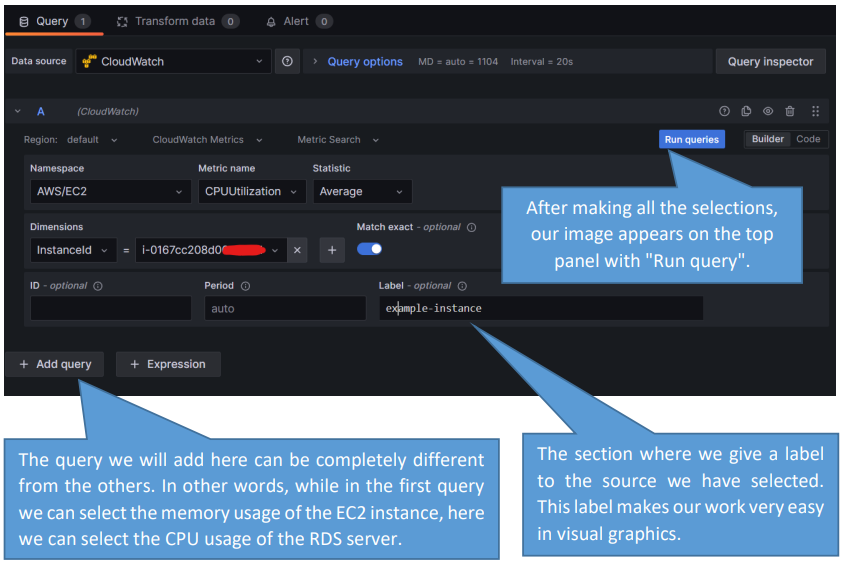
Namespace: This is the section where we want to choose which service in AWS. For example, if we want to see the metrics of our EC2 instance servers, we select “AWS/EC2.” On the other hand, if we want to visualize the metrics of RDS database servers, we select “AWS/RDS”.
Metric name: Select which metric you want to visualize.
Statistic: Choose how you want to see the metrics statistically.
Dimensions: In this section, we see the definitional values of our resources within the service we have selected. For example, we see the “id” number of an EC2 server. So, we can select the server we want to visualize specifically. We can also select multiple resources or all resources together. For example, we can see the CPU usage of all our EC2 servers running on AWS at the same time.
- Grafana’s dashboard editor is famous for being robust and versatile. Here we see this strength of Grafana in action. Users can easily edit dashboards and integrate various visualizations. Users can tailor dashboards to their specific needs.
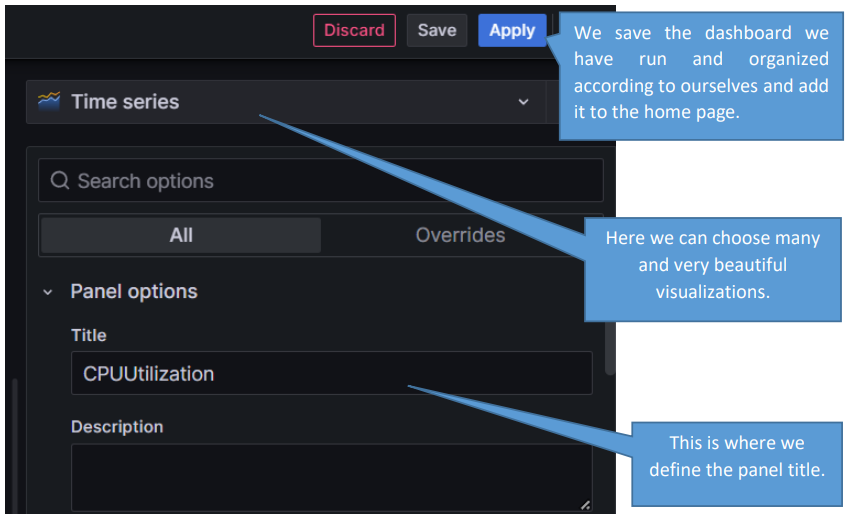
We can make many adjustments in this section. You will see this better by tinkering with it yourself. As we mentioned above, we can see the strong side of Grafana here.
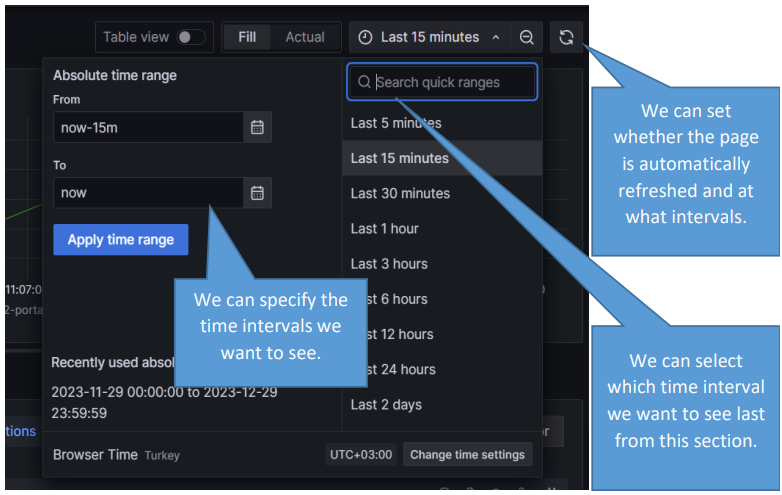
- Grafana has many features, but we share the most used parts. We can see the last uses as much as we want, as well as visualize the uses in a certain time interval again.
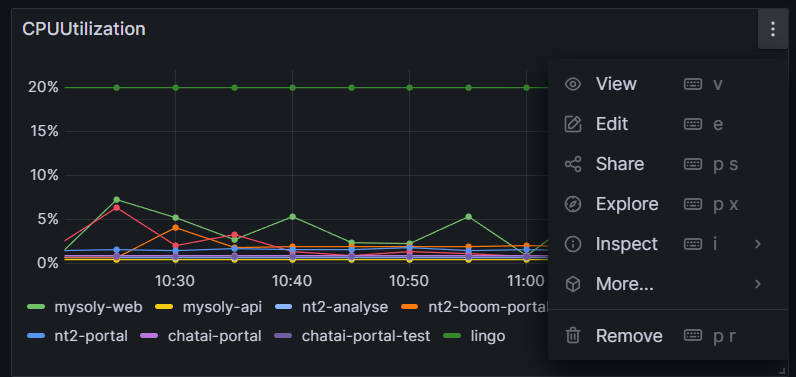
- We can edit the panels we have created. We can delete the panel or easily adjust its size with the mouse and place it in the section we want.
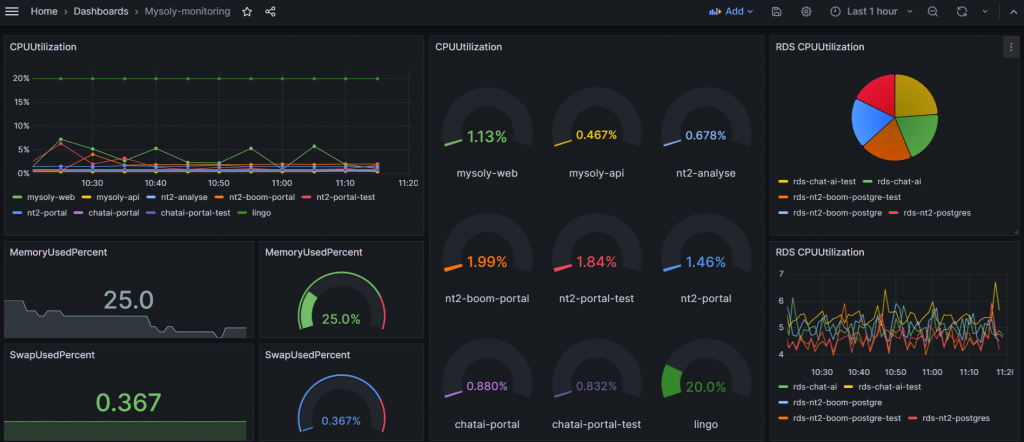
- In this blog, we want to share the latest dashboard from the work we did. More different shapes and designs are in our hands. An eye-catching visualization!
Import Dashboards for Grafana Labs
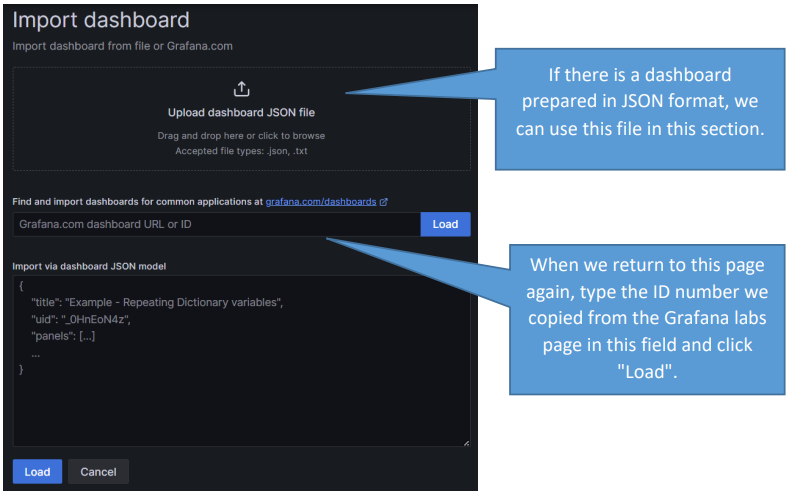
We said that there are dashboards that we create new dashboards for ourselves as well as dashboards that we already have and import. We can access them through special “ID” numbers on the “Grafana Labs” page. These must be dashboards that the data source supports. Now let’s give an example.
On the Grafana Labs page, we find the AWS RDS dashboard.
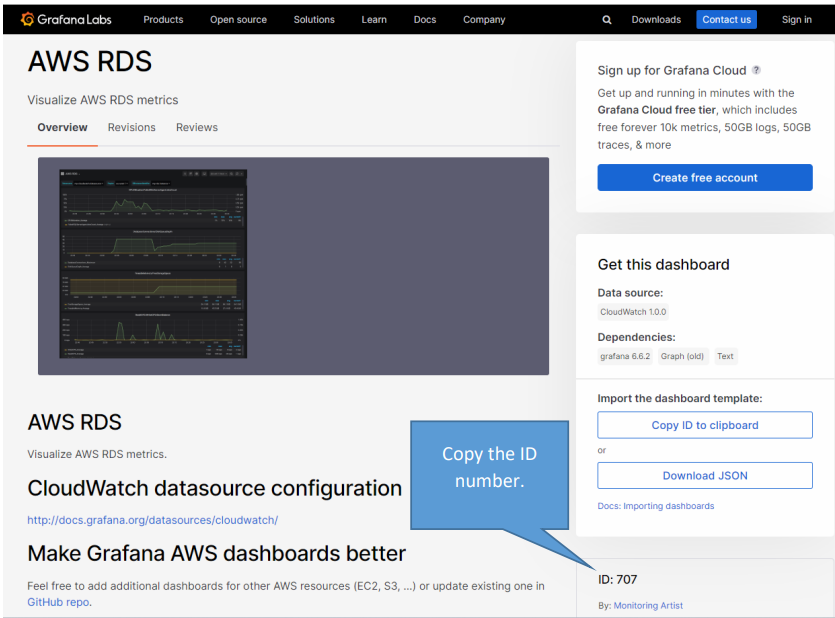
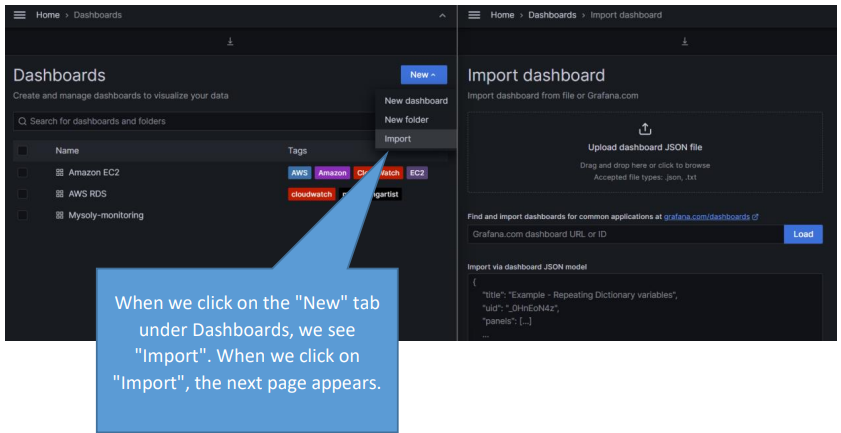
In the screenshot we shared below, we see that the AWS RDS dashboard is included in “dashboards.” It will automatically pull metrics about the RDS servers in our AWS account that we allow Grafana. We can make custom changes on this dashboard.
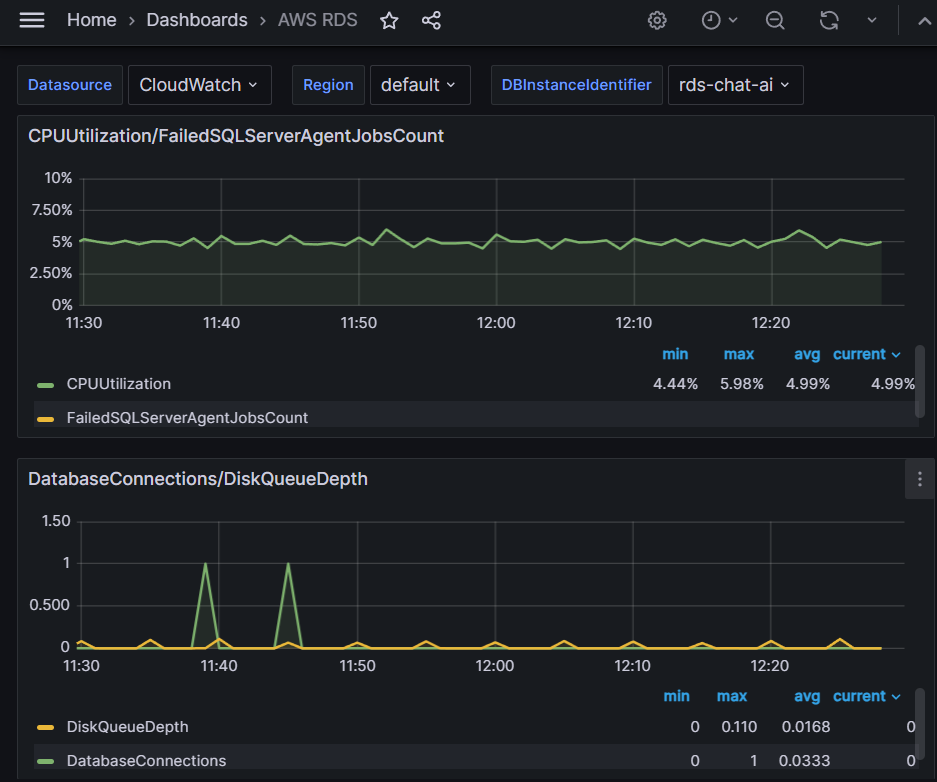
When we enter the AWS RDS dashboard, ready-made metric visuals will appear as below. We have a new dashboard with only one ID number. Metric visuals are prepared for us.
Conclusion
Throughout this guide, we explored Grafana and the enormous potential of data visualization. Thanks to Grafana’s flexibility and user-friendly interface, we can transform your data into more meaningful, interactive, and stunning visualizations. Now you can do your analysis faster, see trends more clearly, and optimize your decisions in a data-driven way. Much more beautiful and eye-appealing visualizations are in your hands. Grafana is a tool that will make your journey in the data world more exciting and productive. Remember, data is not only information but also a power.
Are you ready to empower your data with Grafana?