Visualization and Monitoring with Grafana: An Introductory Guide
Introduction
Visualization and monitoring are integral components in the realm of modern data management. Because they offer organizations valuable insights into the performance, reliability, and overall health of their systems. As the digital landscape is evolving, the need for effective tools to visualize and monitor data increases. So, we will delve into the fundamental concepts of visualization and monitoring in this introductory guide. Moreover, we will explore how these practices contribute to informed decision-making, proactive issue identification, and the optimization of system performance. Whether you are new to the field or seeking a comprehensive overview, this guide provides a solid foundation for understanding the significance of visualization and monitoring in today’s dynamic technological landscape. First, let’s define monitoring, and then delve deeper into Grafana, a monitoring tool that does amazing things in visualization.
The Importance of Monitoring
Monitoring is the process of continuously observing the performance, status, and behavior of software applications, computer systems, and network infrastructures. This process is based on collecting and analyzing instant data by monitoring health and performance. It also involves ensuring the security of application and system components. Monitoring is usually performed using specialized tools and software.
• Performance Optimization:
Monitoring continuously observes application and system performance, providing the ability to identify and address performance issues. This enhances user experience and optimizes the efficiency of the application.
• Error Detection and Troubleshooting:
Monitoring helps in proactively detecting issues before they impact the end-users or the overall system. By setting up alerts based on predefined thresholds, you can be notified when certain metrics exceed acceptable levels. This enables you to address potential problems before they escalate. So, teams can swiftly address problems and ensures the smooth operation of systems.
• Efficiency and Resource Management:
Monitoring allows you to keep a constant eye on resource utilization such as CPU, memory, disk, and network. By analyzing resource metrics, you can identify if any component is reaching its limits and causing performance degradation. This prevents unnecessary resource consumption, resulting in more effective system operation.
• Security Monitoring:
With the advancement of technology, the threat landscape also evolves. Monitoring is essential for detecting and mitigating security threats. It involves continuous surveillance of network traffic, system logs, and user activities to identify potential security breaches. Rapid detection allows organizations to respond promptly and enhance their security measures in response to emerging threats.
• Closed-Loop Feedback:
Monitoring demonstrates how an application or system component is functioning in real-time. This feedback loop can be utilized for continuous improvement and optimization.
• Continuous Improvement:
Regularly monitoring performance metrics provides a basis for continuous improvement. By analyzing trends over time, you can implement iterative optimizations and measure their impact. This iterative approach ensures that your system evolves to meet changing requirements and performance expectations.
• Capacity Planning:
Monitoring assists in capacity planning by providing insights into how resources are being utilized over time. With this information, you can forecast future resource requirements and scale your infrastructure accordingly. This proactive approach ensures that your system can handle increasing workloads without performance degradation.
• Business Continuity and Disaster Recovery:
Monitoring supports quick responses in potential disaster scenarios, contributing to business continuity and ensuring recovery mechanisms are in place.
• Cost Reduction:
Through efficient resource management and rapid resolution of issues, monitoring helps reduce operational costs.
The Role of Monitoring in Evolving Technology
• Big Data and Analytics:
The ongoing evolution of technology opens up new opportunities for collecting and analyzing large volumes of data. Furthermore, organizations can leverage monitoring as a powerful tool to actively derive meaningful insights from these vast data sets.
• Integration of Artificial Intelligence and Machine Learning:
Integrating monitoring systems with artificial intelligence and machine learning algorithms enables the acquisition of automatic learning and understanding capabilities. This, in turn, boosts the ability to swiftly detect and predict issues.
• Internet of Things (IoT):
The advancement of IoT technology has exposed complex network infrastructures where millions of devices are interconnected. Monitoring plays a crucial role in swiftly resolving issues within these large and distributed networks.
• Digital Transformation Projects:
Within the digital transformation processes of companies, monitoring plays a crucial role in tracking the performance and security of applications and systems. This facilitates continuous improvements, providing a competitive advantage.
• Automation and Continuous Integration/Delivery (CI/CD):
Monitoring supports automation processes, contributing to the smooth operation of continuous integration and continuous delivery (CI/CD) applications.
Today, the complexity of software applications and the dynamic nature of computer systems further increase the importance of monitoringIn the ever-changing and complex environment of IT infrastructure, monitoring has become an indispensable tool. Because it plays a crucial role in maintaining the health, security, and performance of applications. So, the selection of an effective monitoring tool is crucial to successfully managing many critical factors. These include performance optimization, error detection, and efficiency. On the other hand, it also plays a pivotal role in security monitoring and closed-loop feedback, ensuring a comprehensive approach to IT infrastructure management.
In today’s technology where monitoring is very important, we chose Grafana. We aim to fulfill this challenging task and to visualize this data in a meaningful way with Grafana. Now we will continue the article on Grafana as a monitoring tool.
Decoding Grafana: An Overview

Grafana is an open-source visualization and dashboard tool for visualizing and tracking metrics and data. Torkel Ödegaard initiated Grafana in 2013, and Grafana Labs, a company situated in Sweden, now powers it. The first version was released in March 2014 and has been continuously improved since then.
Thanks to Grafana, users can see their data through graphs on one or multiple dashboards for easier interpretation and understanding. Users can query and set alerts from anywhere their information and metrics are stored, such as traditional server environments, containers, various cloud services, etc. So they can analyze data more easily and make their applications more efficient. Thanks to its exclusive features, Grafana can be viewed and analyzed by multiple people. This means that data can be easily found and used by anyone who needs it.
In Grafana, you can configure everything depending on your needs and use case. For example, in a data center or production facility, temperature and humidity levels need to be monitored. By monitoring temperature and humidity data from sensors in real time, it can send alerts when thresholds are exceeded. On the other hand, if you are the administrator of a shopping website, you can decide on discounts or advertisements based on the heavy traffic coming to the servers at certain hours. With Grafana, you can create a wide variety of visuals.
Harnessing Grafana's Power
• Supporting Many Data Sources:
One of the remarkable features of Grafana is its comprehensive support for a wide range of data sources. Whether working with log data, time series databases or traditional databases, it can seamlessly integrate with a variety of sources.
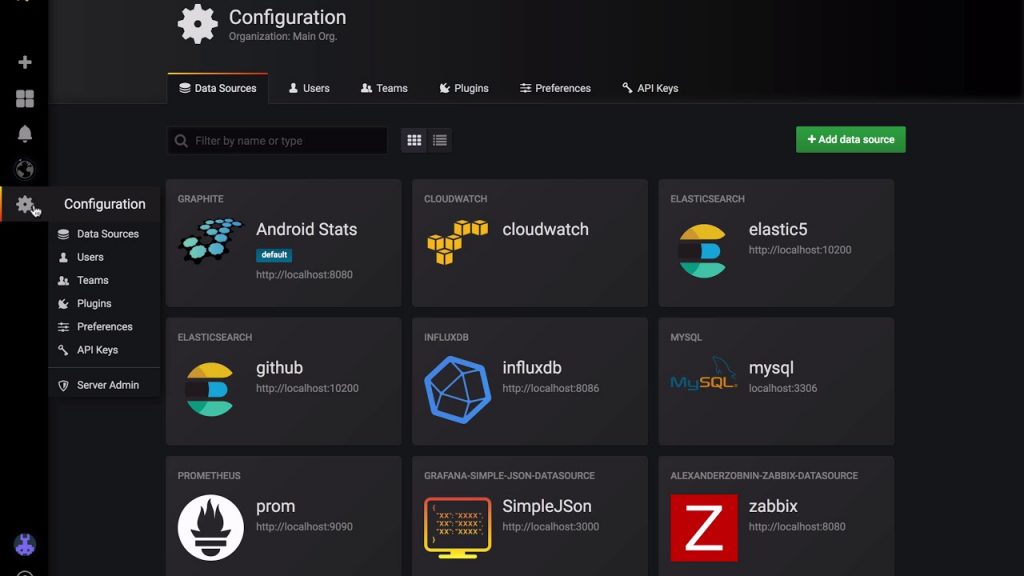
These include time series databases (such as InfluxDB, Prometheus, Graphite), SQL and NoSQL databases (such as MySQL, PostgreSQL, Elasticsearch), cloud services (such as AWS CloudWatch, Azure Monitor), log files and more. Thanks to Grafana, users can access and visualize data from these various sources in one place. This flexibility makes it a versatile tool for system monitoring.
• Dashboard Organizer Superiority:
Its dashboard editor is known for being robust and versatile. Because it empowers users to easily edit panels and integrate various visualizations. The intuitive interface allows for the seamless editing of panels and integrating various visualizations. So users can tailor their dashboards to their specific needs. Grafana’s user-friendly interface facilitates the quick creation of graphs and dashboards.
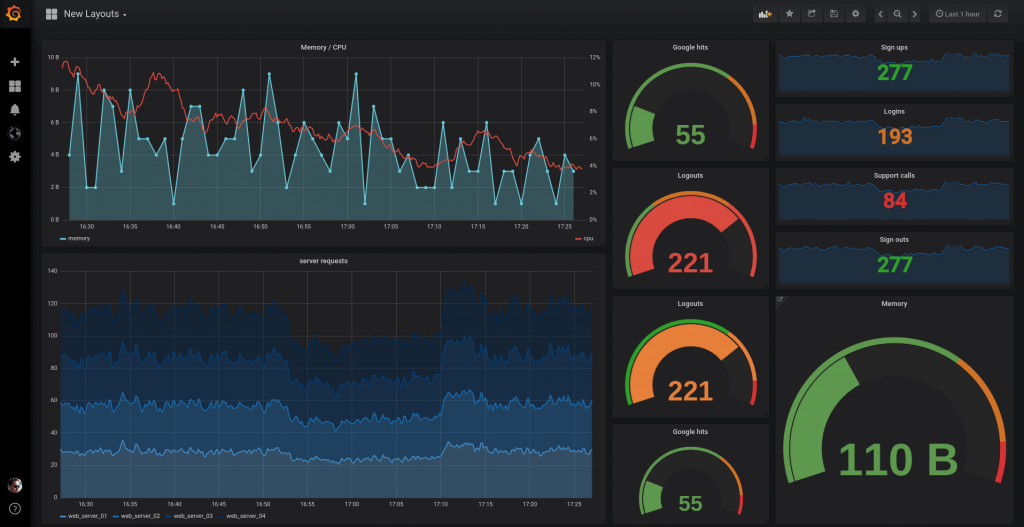
Grafana offers a variety of visualization options, from traditional charts and graphs to heat maps and gauges. Thus users can visualize data in the most effective way, improving the clarity and interpretability of information.
• Real-Time Monitoring and Alerts:
When monitoring your processes, it is important to be notified quickly when something goes wrong or moves abnormally. This is vital to keep your systems healthy and prevent application outages or minimize downtime.
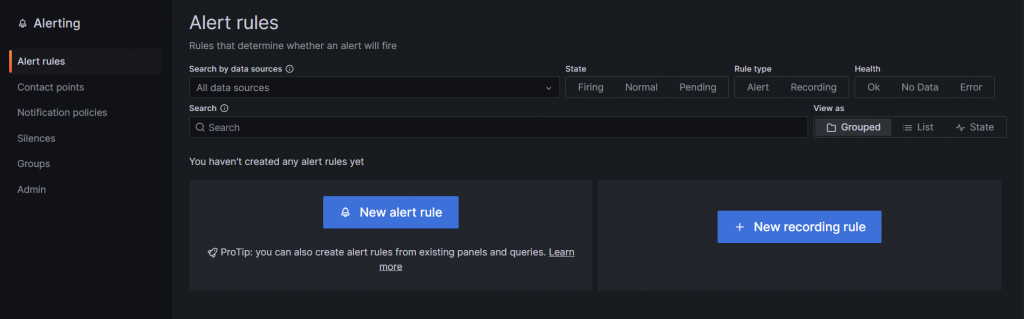
Grafana supports real-time data monitoring and alerting systems. Users can receive alerts when a specific data point exceeds a defined threshold or when a condition changes. This proactive monitoring approach allows users to quickly learn of any anomalies or issues. So, rapid responses and proactive troubleshooting can be done to maintain system health. Users get these alerts via email, Slack or other communication channels.
• User Based Authorization and Access Control:
Effective user management is critical for collaborative environments. Grafana allows users to manage their access levels and permissions. Users can control access to specific data sources, dashboards or dashboard components and set data sharing or collaboration capabilities. This increases security and collaboration by ensuring the right people have access to the right information.
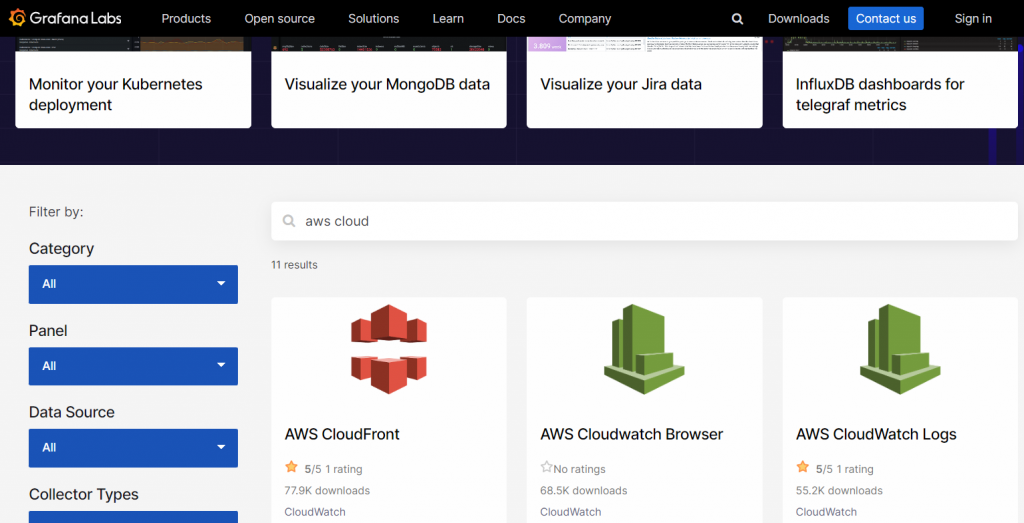
• Grafana has a vibrant and interactive community:
It includes community support, active forums, documentation and many plugins provided by users. This collaborative ecosystem increases its usability and provides users with a wide range of information and resources. Grafana provides a panel marketplace where users can find a variety of pre-built panels, panel components and themes. This serves as a resource for users to quickly create their own dashboards or customize existing ones.
• API Support:
Grafana offers extensive API support that allows you to access data using RESTful APIs, making it possible to automate the platform. This feature is extremely valuable for developers and system administrators who want to integrate Grafana with other systems and use it for automation scenarios.
Grafana’s API can retrieve data from different data sources, create dashboards, configure dashboard settings, and manage users. The API uses the standard HTTP protocol and exchanges data in JSON format.
Managing Grafana Effectively
Grafana has different management levels to cater to various user needs and expectations. These management levels allow users to choose based on their needs and business requirements. Users can leverage the open-source nature of Grafana for free or opt for cloud or enterprise versions if additional features and support levels are required.
The primary management levels of Grafana are as follows:
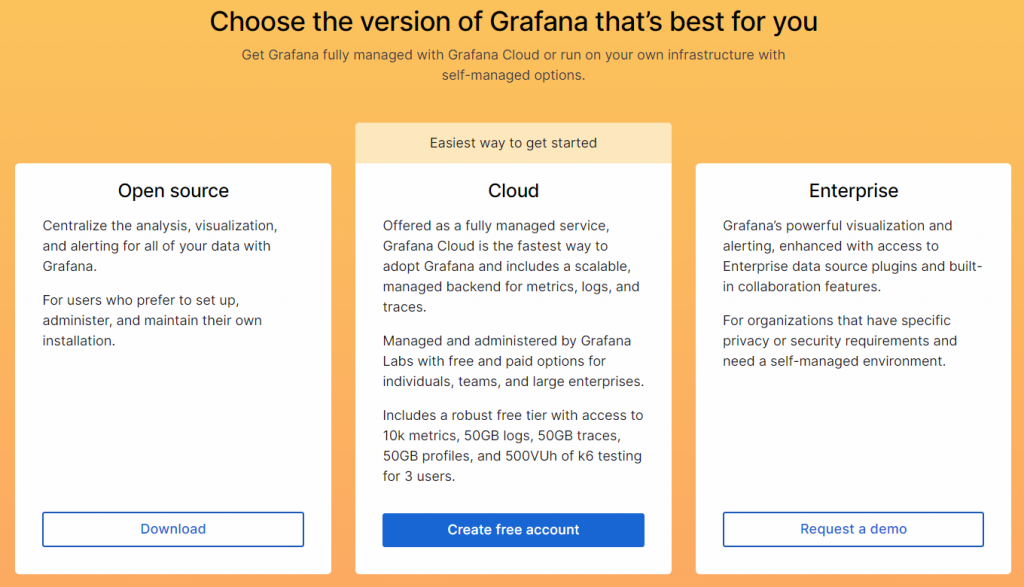
1. Grafana Open Source (Community Edition):
Grafana Open Source is the basic version of Grafana that can be used for free. At this level, users can download Grafana and install it on their own servers or infrastructure. Grafana Free provides basic data analysis, visualization, and monitoring capabilities. Users can connect to data sources, create and customize panels, visualize data, and utilize other core features of Grafana.
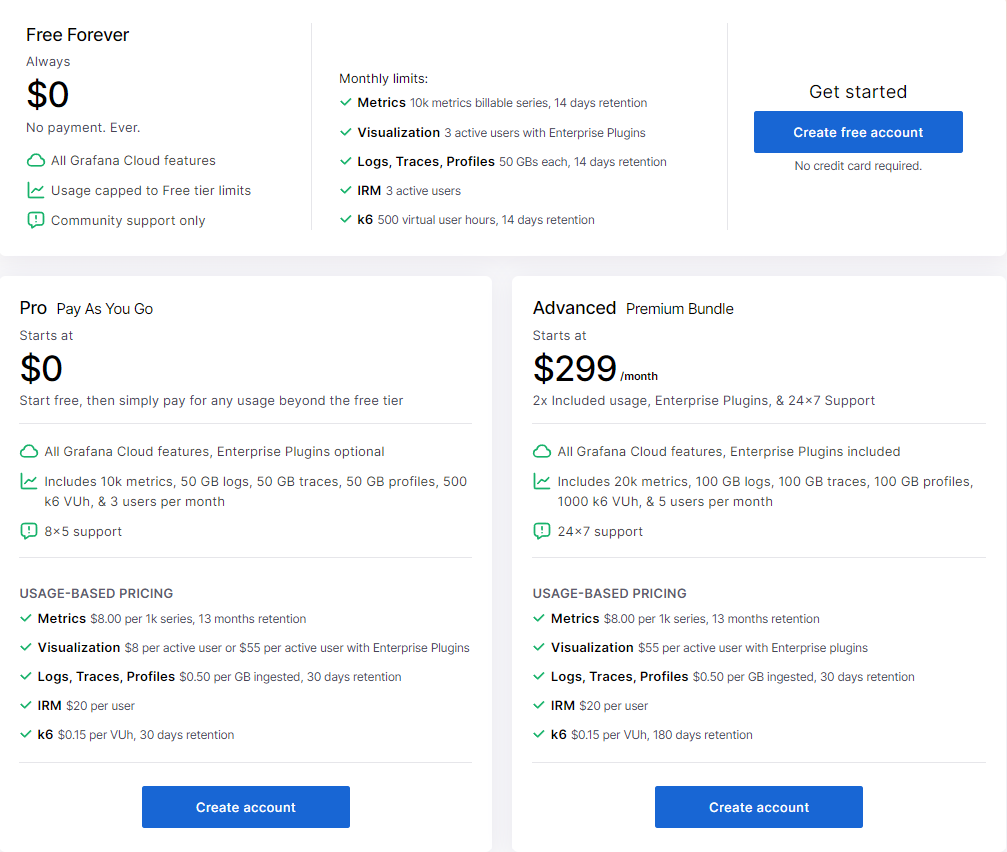
2. Grafana Cloud:
Grafana Cloud is a cloud-based service offered by Grafana Labs. At this level, users can quickly get started with Grafana without the need for hosting or managing it themselves. Moreover, it offers scalability, security, and other cloud advantages. Users benefit from faster deployment, ease of management, and scalability by leveraging the cloud-based Grafana service. Grafana Cloud provides a free starting level and also offers paid subscription options for more advanced features.
3. Grafana Enterprise:
Grafana Enterprise is a commercial version offered by Grafana Labs. This level includes advanced features, security, scalability, and control capabilities to meet the needs of large-scale enterprises. Grafana Enterprise offers the features of Grafana Free while offering additional features and services. It also provides support services, security patches, and other exclusive advantages. It typically requires custom licensing or subscription.
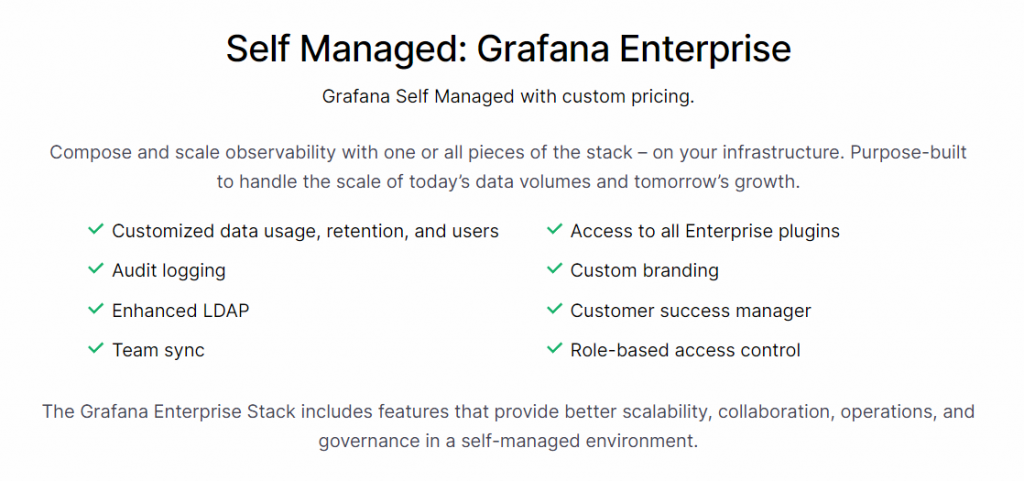
4. Grafana Enterprise Stack:
Grafana Enterprise Stack is a software package offered by Grafana Labs. This package builds upon Grafana Enterprise and provides additional features, services, and support. Grafana Enterprise Stack aims to meet the needs of large-scale businesses. It may include additional components such as Grafana Agent, Grafana Tempo, and Grafana Loki. So it can provide more comprehensive data analysis, monitoring, and event management capabilities.
These four management levels provide users with different options to have a Grafana experience that suits their needs. Grafana Free allows users to use Grafana for free. On the other hand, Grafana Cloud, Grafana Enterprise, and Grafana Enterprise Stack offer more advanced features, services, and support. Thus, businesses can choose the most appropriate management level according to their requirements.
Conclusion
Grafana emerges as a formidable ally in the realm of data management and analysis. Because it offers valuable features such as meaningful visualization, real-time monitoring, flexibility, alerts, and extensive plugin support. This comprehensive tool not only excels in visualizing complex data sets but also promotes collaboration and facilitates data-driven decision-making. By seamlessly integrating monitoring capabilities, it ensures businesses not only gain a competitive edge but also fortify their data-driven strategies, maintaining leadership positions in the ever-evolving business landscape.
Happy Learning!
Note: In this article, we talked about monitoring and Grafana definitions and features in general. In the next article, we will cover more specific topics such as installing Grafana (we will run Grafana as a container on a server of AWS), connecting to Grafana, adding a data source (we will use AWS CloudWatch as a data source), pulling metrics from the graphical interface, creating and editing dashboards.
Sources: Official Website